

Question: Using the following data calculate a and b and graph CAL table [ [ Expected return of market portfolio, 0 . 1 5 ]
Using the following data calculate a and and graph CAL
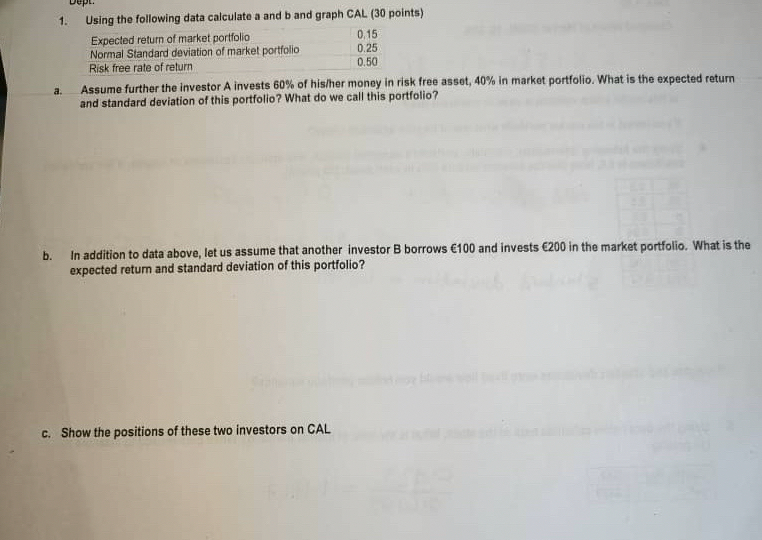
tableExpected return of market portfolio,Normal Standard deviation of market portfolio,Risk free rate of return,
a Assume further the investor A invests of hisher money in risk free asset, in market portfolio. What is the expected return and standard deviation of this portfolio? What do we call this portfolio?
b In addition to data above, let us assume that another investor B borrows and invests in the market portfolio. What is the expected retum and standard deviation of this portfolio?
c Show the positions of these two investors on CAL
Step by Step Solution
There are 3 Steps involved in it
1 Expert Approved Answer
Step: 1 Unlock

Question Has Been Solved by an Expert!
Get step-by-step solutions from verified subject matter experts
Step: 2 Unlock
Step: 3 Unlock