

Question: Using the following data, plot the two demand curves and the supply curve on graph paper. Label the x-axis and y-axis and give the
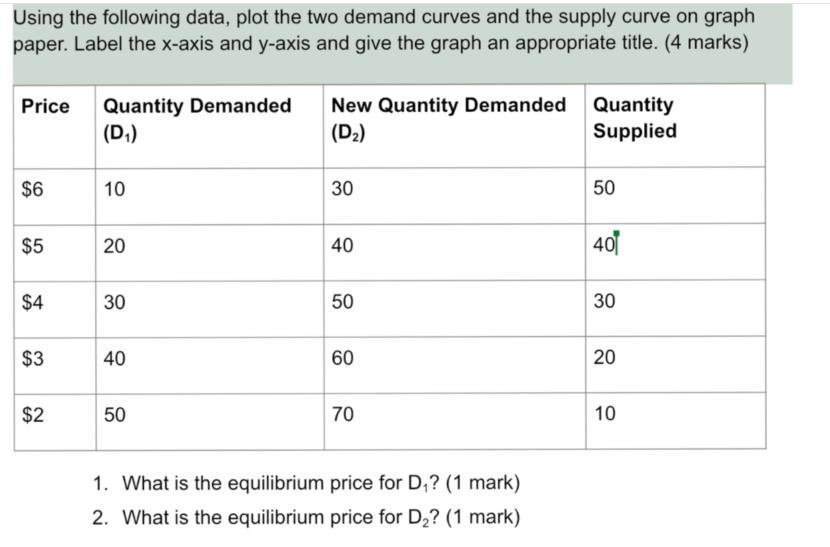
Using the following data, plot the two demand curves and the supply curve on graph paper. Label the x-axis and y-axis and give the graph an appropriate title. (4 marks) Price Quantity Demanded (D) $6 $5 $4 $3 $2 10 20 30 40 50 New Quantity Demanded Quantity (D) Supplied 30 40 50 60 70 1. What is the equilibrium price for D? (1 mark) 2. What is the equilibrium price for D? (1 mark) 50 40 30 20 10
Step by Step Solution
3.50 Rating (160 Votes )
There are 3 Steps involved in it
To plot the demand and supply curves well use the given data The x... View full answer

Get step-by-step solutions from verified subject matter experts