

Question: Using the following data points from these 5 sub-groups, draw x-bar and R-bar: begin{tabular}{|c|c|c|c|} hline Sub-group & Sample1 & Sample2 & Sample3 hline 1
Using the following data points from these 5 sub-groups, draw x-bar and R-bar:
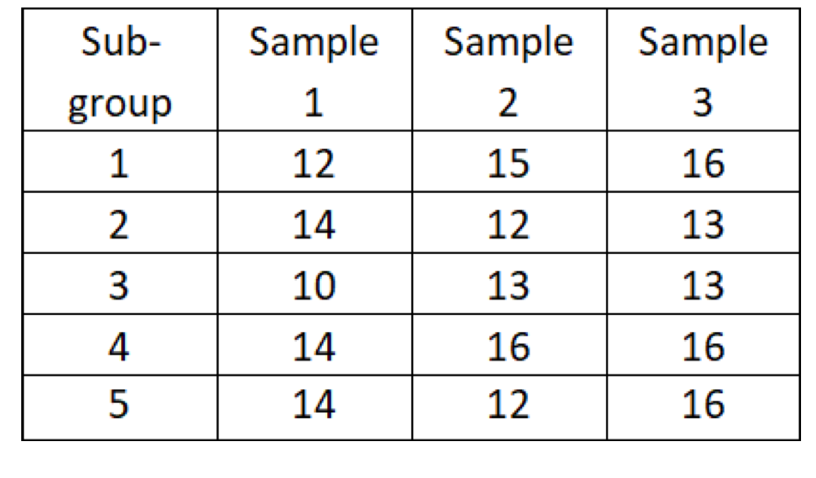
\begin{tabular}{|c|c|c|c|} \hline Sub-group & Sample1 & Sample2 & Sample3 \\ \hline 1 & 12 & 15 & 16 \\ \hline 2 & 14 & 12 & 13 \\ \hline 3 & 10 & 13 & 13 \\ \hline 4 & 14 & 16 & 16 \\ \hline 5 & 14 & 12 & 16 \\ \hline \end{tabular}
Step by Step Solution
There are 3 Steps involved in it
1 Expert Approved Answer
Step: 1 Unlock

Question Has Been Solved by an Expert!
Get step-by-step solutions from verified subject matter experts
Step: 2 Unlock
Step: 3 Unlock