

Question: The following plot shows a typical titration curve for the titration of diprotic acid HA (Kal = 1.2 x10; K2=2.1 x 10-0) with NaOH.
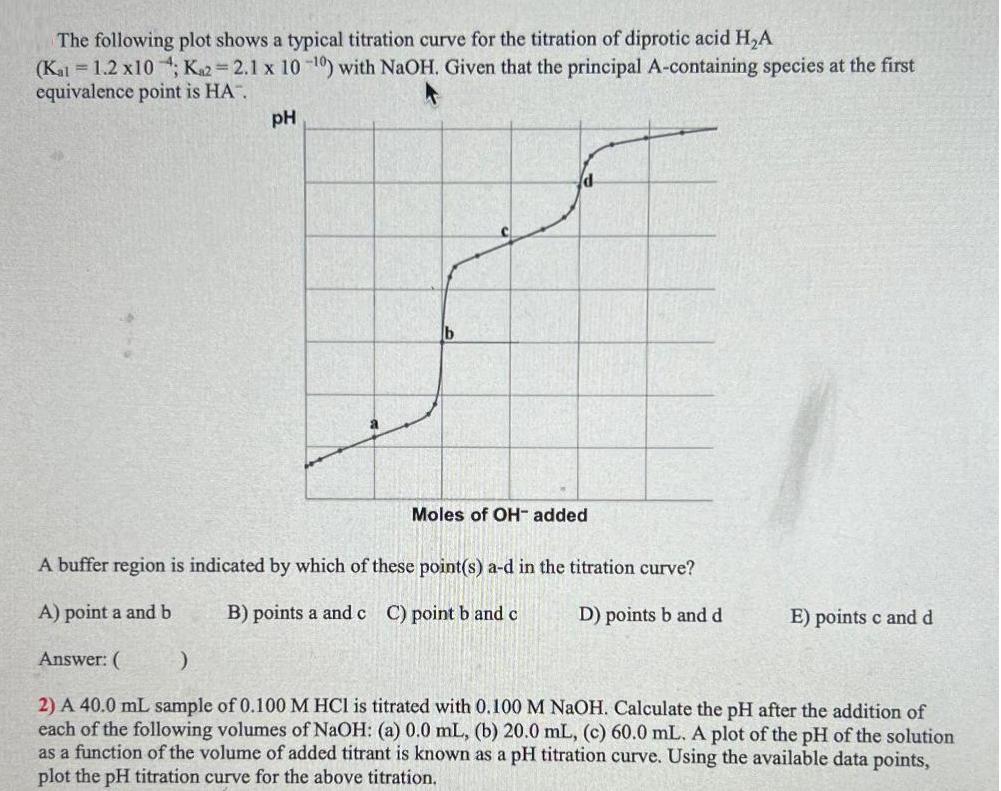
The following plot shows a typical titration curve for the titration of diprotic acid HA (Kal = 1.2 x10; K2=2.1 x 10-0) with NaOH. Given that the principal A-containing species at the first equivalence point is HA". pH Moles of OH- added A buffer region is indicated by which of these point(s) a-d in the titration curve? A) point a and b B) points a and c C) point b and c D) points b and d Answer: ( ) 2) A 40.0 mL sample of 0.100 M HCl is titrated with 0.100 M NaOH. Calculate the pH after the addition of each of the following volumes of NaOH: (a) 0.0 mL, (b) 20.0 mL, (c) 60.0 mL. A plot of the pH of the solution as a function of the volume of added titrant is known as a pH titration curve. Using the available data points, plot the pH titration curve for the above titration. E) points c and d
Step by Step Solution
3.31 Rating (151 Votes )
There are 3 Steps involved in it
buffer is given when there are conjguate base weak acid these are points in which pH wont change dra... View full answer

Get step-by-step solutions from verified subject matter experts