

Question: The data used for Figure can be viewed as being generated by h5. For each of the other four hypotheses, generate a data set of
The data used for Figure can be viewed as being generated by h5. For each of the other four hypotheses, generate a data set of length 100 and plot the corresponding graphs for P (hi?d1... dm) and P (D m + 1 = lime?d1. . . dm). Comment on your results.
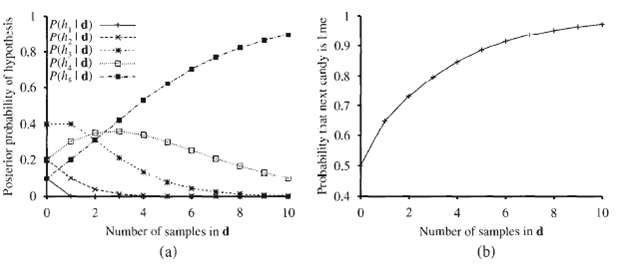
Pih, Id) P(A, I d) 0.8 P(h, I d) P(h, I d) Pih, I d) 0.6 0.9 0.8 0.7 0.4 0.6 0.2 0.5 0.4 2 10 6. 8. 10 Number of samples in d Number of samples in d (b) (a) Posterior probability of hypothesis Probability that next candy is I me
Step by Step Solution
3.50 Rating (160 Votes )
There are 3 Steps involved in it
The code for this exercise is a straightforward implementation of Equations 201 and Figure shows the ... View full answer

Get step-by-step solutions from verified subject matter experts
Document Format (1 attachment)
21-C-S-A-I (277).docx
120 KBs Word File