

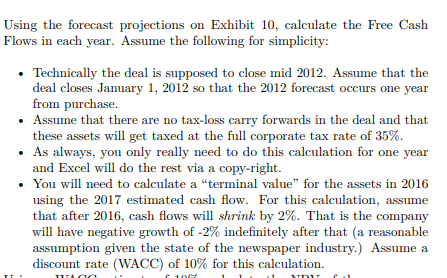
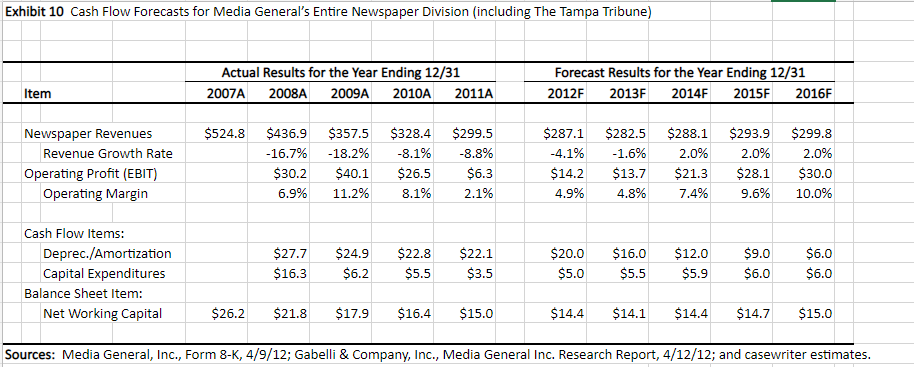
Using the forecast projections on Exhibit 10, calculate the Free Cash Flows in each year. Assume...
Fantastic news! We've Found the answer you've been seeking!
Question:
Transcribed Image Text:
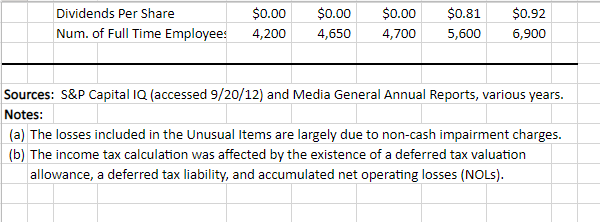
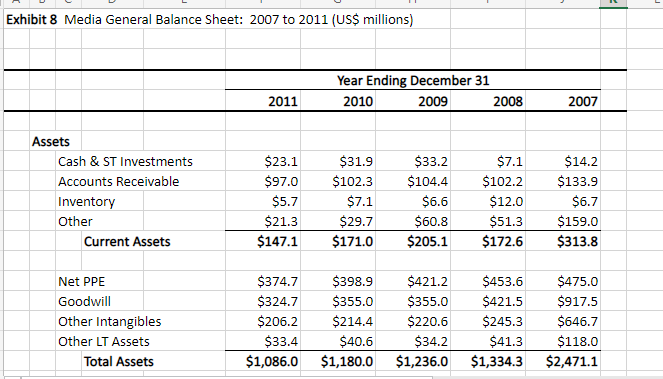
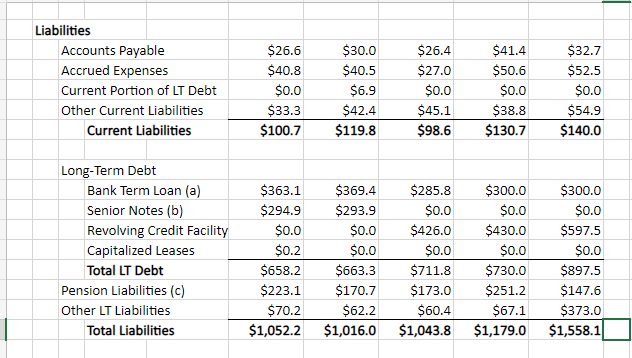
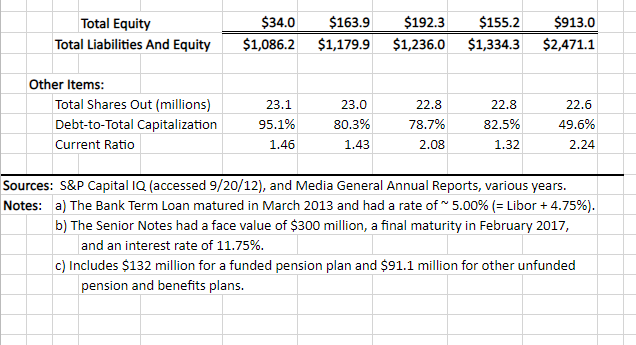
Using the forecast projections on Exhibit 10, calculate the Free Cash Flows in each year. Assume the following for simplicity: Technically the deal is supposed to close mid 2012. Assume that the deal closes January 1, 2012 so that the 2012 forecast occurs one year from purchase. Assume that there are no tax-loss carry forwards in the deal and that these assets will get taxed at the full corporate tax rate of 35%. As always, you only really need to do this calculation for one year and Excel will do the rest via a copy-right. You will need to calculate a "terminal value" for the assets in 2016 using the 2017 estimated cash flow. For this calculation, assume that after 2016, cash flows will shrink by 2%. That is the company will have negative growth of -2% indefinitely after that (a reasonable assumption given the state of the newspaper industry.) Assume a discount rate (WACC) of 10% for this calculation. Exhibit 10 Cash Flow Forecasts for Media General's Entire Newspaper Division (including The Tampa Tribune) Item Newspaper Revenues Revenue Growth Rate Operating Profit (EBIT) Operating Margin Cash Flow Items: Deprec./Amortization Capital Expenditures Balance Sheet Item: Actual Results for the Year Ending 12/31 2007A 2008A 2009A 2010A 2011A $524.8 $436.9 $357.5 $328.4 -16.7% -18.2% -8.1% $30.2 $40.1 $26.5 6.9% 11.2% 8.1% $27.7 $24.9 $16.3 $6.2 $299.5 -8.8% $6.3 2.1% $22.8 $22.1 $5.5 $3.5 Forecast Results for the Year Ending 12/31 2012F 2013F 2014F 2015F 2016F $287.1 $282.5 $288.1 -1.6% -4.1% 2.0% $14.2 $13.7 $21.3 4.9% 4.8% 7.4% $20.0 $5.0 $16.0 $12.0 $5.5 $5.9 $293.9 $299.8 2.0% 2.0% $28.1 9.6% $9.0 $6.0 $30.0 10.0% $6.0 $6.0 Net Working Capital $26.2 $21.8 $17.9 $16.4 $15.0 $14.4 $14.1 $14.4 $14.7 Sources: Media General, Inc., Form 8-K, 4/9/12; Gabelli & Company, Inc., Media General Inc. Research Report, 4/12/12; and casewriter estimates. $15.0 Exhibit 7 Media General Income Statement: 2007 to 2011 ($ millions) Revenue Publishing/Newspapers Broadcasting/TV Digital Media Total Revenue Cost of Goods Sold Gross Profit SG&A Deprec./Amortization Other Expense Operating Income (EBIT) 2011 Fiscal Years Ending December 31 2010 2009 2008 $299.6 $278.7 $328.4 $357.5 $436.9 $306.8 $259.0 $38.0 $43.0 $41.1 $616.3 $678.2 $657.6 $419.7 $442.9 $448.6 $196.6 $524.8 $322.1 $336.5 $38.4 $35.0 $797.4 $896.3 $562.6 $610.6 $235.3 $209.0 $234.8 $285.7 $106.6 $107.9 $51.6 $53.1 $59.2 $0.0 $0.0 $38.4 $74.3 $94.0 $111.5 $71.5 $0.0 $51.8 2007 $0.0 $55.8 $124.9 $73.0 $0.0 $87.8 Interest Expense (net) Other Income/Expense Unusual Items (loss) (a) Profit Before Tax Income Tax (b) Profit After Tax Inc/Loss from Discont. Ops. Net Income Other Items: Revenue Growth Rate EBITDA Margin Operating (EBIT) Margin Net Income Margin Interest Coverage Capital Expenditures $64.4 $1.0 ($38.5) ($63.5) -9.1% 14.6% 6.2% -12.0% $71.1 $1.0 0.6 $19.1 $10.7 $25.4 ($28.6) ($288.2) ($74.2) ($22.6) $0.0 $0.0 ($74.2) ($22.6) $41.3 $1.0 ($1.3) ($88.9) ($920.8) $2.9 ($73.4) ($911.4) 3.1% 18.8% 11.0% -3.3% 1.0 $26.5 $43.4 $1.0 ($44.8) ($623.2) $9.0 ($8.6) ($35.8) ($631.8) -17.5% 17.5% -11.0% 15.5% 8.5% 6.5% -5.4% -79.2% 1.4 $18.5 1.2 $31.5 $59.6 $1.1 ($17.2) $12.2 $2.9 $9.2 $1.5 $10.7 n/a 17.9% 9.8% 1.2% 1.5 $78.1 Dividends Per Share $0.00 Num. of Full Time Employees 4,200 $0.00 $0.00 $0.81 $0.92 4,650 4,700 5,600 6,900 Sources: S&P Capital IQ (accessed 9/20/12) and Media General Annual Reports, various years. Notes: (a) The losses included in the Unusual Items are largely due to non-cash impairment charges. (b) The income tax calculation was affected by the existence of a deferred tax valuation allowance, a deferred tax liability, and accumulated net operating losses (NOLs). Exhibit 8 Media General Balance Sheet: 2007 to 2011 (US$ millions) Assets Cash & ST Investments Accounts Receivable Inventory Other Current Assets Net PPE Goodwill Other Intangibles Other LT Assets Total Assets 2011 $23.1 $97.0 $5.7 $21.3 $147.1 Year Ending December 31 2010 2009 $31.9 $102.3 $7.1 $29.7 $171.0 $33.2 $104.4 $6.6 $60.8 $205.1 $374.7 $398.9 $421.2 $324.7 $355.0 $355.0 $206.2 $214.4 $33.4 $40.6 $1,086.0 $1,180.0 2008 $7.1 $102.2 $12.0 $51.3 $172.6 $453.6 $421.5 $220.6 $245.3 $34.2 $41.3 $1,236.0 $1,334.3 2007 $14.2 $133.9 $6.7 $159.0 $313.8 $475.0 $917.5 $646.7 $118.0 $2,471.1 Liabilities Accounts Payable Accrued Expenses Current Portion of LT Debt Other Current Liabilities Current Liabilities Long-Term Debt Bank Term Loan (a) Senior Notes (b) Revolving Credit Facility Capitalized Leases Total LT Debt Pension Liabilities (c) Other LT Liabilities Total Liabilities $26.6 $40.8 $0.0 $33.3 $100.7 $363.1 $294.9 $0.0 $0.2 $658.2 $223.1 $70.2 $1,052.2 $30.0 $40.5 $6.9 $42.4 $119.8 $369.4 $293.9 $26.4 $27.0 $0.0 $0.0 $0.0 $45.1 $98.6 $285.8 $300.0 $0.0 $0.0 $426.0 $430.0 $0.0 $0.0 $663.3 $711.8 $730.0 $170.7 $173.0 $251.2 $62.2 $60.4 $67.1 $1,016.0 $1,043.8 $1,179.0 $41.4 $50.6 $0.0 $38.8 $130.7 $32.7 $52.5 $0.0 $54.9 $140.0 $300.0 $0.0 $597.5 $0.0 $897.5 $147.6 $373.0 $1,558.1 Total Equity Total Liabilities And Equity Other Items: Total Shares Out (millions) Debt-to-Total Capitalization Current Ratio $34.0 $163.9 $192.3 $155.2 $913.0 $1,086.2 $1,179.9 $1,236.0 $1,334.3 $2,471.1 23.1 95.1% 1.46 23.0 80.3% 1.43 22.8 78.7% 2.08 22.8 82.5% 1.32 22.6 49.6% 2.24 Sources: S&P Capital IQ (accessed 9/20/12), and Media General Annual Reports, various years. Notes: a) The Bank Term Loan matured in March 2013 and had a rate of ~ 5.00% (= Libor +4.75%). b) The Senior Notes had a face value of $300 million, a final maturity in February 2017, and an interest rate of 11.75%. c) Includes $132 million for a funded pension plan and $91.1 million for other unfunded pension and benefits plans. Using the forecast projections on Exhibit 10, calculate the Free Cash Flows in each year. Assume the following for simplicity: Technically the deal is supposed to close mid 2012. Assume that the deal closes January 1, 2012 so that the 2012 forecast occurs one year from purchase. Assume that there are no tax-loss carry forwards in the deal and that these assets will get taxed at the full corporate tax rate of 35%. As always, you only really need to do this calculation for one year and Excel will do the rest via a copy-right. You will need to calculate a "terminal value" for the assets in 2016 using the 2017 estimated cash flow. For this calculation, assume that after 2016, cash flows will shrink by 2%. That is the company will have negative growth of -2% indefinitely after that (a reasonable assumption given the state of the newspaper industry.) Assume a discount rate (WACC) of 10% for this calculation. Exhibit 10 Cash Flow Forecasts for Media General's Entire Newspaper Division (including The Tampa Tribune) Item Newspaper Revenues Revenue Growth Rate Operating Profit (EBIT) Operating Margin Cash Flow Items: Deprec./Amortization Capital Expenditures Balance Sheet Item: Actual Results for the Year Ending 12/31 2007A 2008A 2009A 2010A 2011A $524.8 $436.9 $357.5 $328.4 -16.7% -18.2% -8.1% $30.2 $40.1 $26.5 6.9% 11.2% 8.1% $27.7 $24.9 $16.3 $6.2 $299.5 -8.8% $6.3 2.1% $22.8 $22.1 $5.5 $3.5 Forecast Results for the Year Ending 12/31 2012F 2013F 2014F 2015F 2016F $287.1 $282.5 $288.1 -1.6% -4.1% 2.0% $14.2 $13.7 $21.3 4.9% 4.8% 7.4% $20.0 $5.0 $16.0 $12.0 $5.5 $5.9 $293.9 $299.8 2.0% 2.0% $28.1 9.6% $9.0 $6.0 $30.0 10.0% $6.0 $6.0 Net Working Capital $26.2 $21.8 $17.9 $16.4 $15.0 $14.4 $14.1 $14.4 $14.7 Sources: Media General, Inc., Form 8-K, 4/9/12; Gabelli & Company, Inc., Media General Inc. Research Report, 4/12/12; and casewriter estimates. $15.0 Exhibit 7 Media General Income Statement: 2007 to 2011 ($ millions) Revenue Publishing/Newspapers Broadcasting/TV Digital Media Total Revenue Cost of Goods Sold Gross Profit SG&A Deprec./Amortization Other Expense Operating Income (EBIT) 2011 Fiscal Years Ending December 31 2010 2009 2008 $299.6 $278.7 $328.4 $357.5 $436.9 $306.8 $259.0 $38.0 $43.0 $41.1 $616.3 $678.2 $657.6 $419.7 $442.9 $448.6 $196.6 $524.8 $322.1 $336.5 $38.4 $35.0 $797.4 $896.3 $562.6 $610.6 $235.3 $209.0 $234.8 $285.7 $106.6 $107.9 $51.6 $53.1 $59.2 $0.0 $0.0 $38.4 $74.3 $94.0 $111.5 $71.5 $0.0 $51.8 2007 $0.0 $55.8 $124.9 $73.0 $0.0 $87.8 Interest Expense (net) Other Income/Expense Unusual Items (loss) (a) Profit Before Tax Income Tax (b) Profit After Tax Inc/Loss from Discont. Ops. Net Income Other Items: Revenue Growth Rate EBITDA Margin Operating (EBIT) Margin Net Income Margin Interest Coverage Capital Expenditures $64.4 $1.0 ($38.5) ($63.5) -9.1% 14.6% 6.2% -12.0% $71.1 $1.0 0.6 $19.1 $10.7 $25.4 ($28.6) ($288.2) ($74.2) ($22.6) $0.0 $0.0 ($74.2) ($22.6) $41.3 $1.0 ($1.3) ($88.9) ($920.8) $2.9 ($73.4) ($911.4) 3.1% 18.8% 11.0% -3.3% 1.0 $26.5 $43.4 $1.0 ($44.8) ($623.2) $9.0 ($8.6) ($35.8) ($631.8) -17.5% 17.5% -11.0% 15.5% 8.5% 6.5% -5.4% -79.2% 1.4 $18.5 1.2 $31.5 $59.6 $1.1 ($17.2) $12.2 $2.9 $9.2 $1.5 $10.7 n/a 17.9% 9.8% 1.2% 1.5 $78.1 Dividends Per Share $0.00 Num. of Full Time Employees 4,200 $0.00 $0.00 $0.81 $0.92 4,650 4,700 5,600 6,900 Sources: S&P Capital IQ (accessed 9/20/12) and Media General Annual Reports, various years. Notes: (a) The losses included in the Unusual Items are largely due to non-cash impairment charges. (b) The income tax calculation was affected by the existence of a deferred tax valuation allowance, a deferred tax liability, and accumulated net operating losses (NOLs). Exhibit 8 Media General Balance Sheet: 2007 to 2011 (US$ millions) Assets Cash & ST Investments Accounts Receivable Inventory Other Current Assets Net PPE Goodwill Other Intangibles Other LT Assets Total Assets 2011 $23.1 $97.0 $5.7 $21.3 $147.1 Year Ending December 31 2010 2009 $31.9 $102.3 $7.1 $29.7 $171.0 $33.2 $104.4 $6.6 $60.8 $205.1 $374.7 $398.9 $421.2 $324.7 $355.0 $355.0 $206.2 $214.4 $33.4 $40.6 $1,086.0 $1,180.0 2008 $7.1 $102.2 $12.0 $51.3 $172.6 $453.6 $421.5 $220.6 $245.3 $34.2 $41.3 $1,236.0 $1,334.3 2007 $14.2 $133.9 $6.7 $159.0 $313.8 $475.0 $917.5 $646.7 $118.0 $2,471.1 Liabilities Accounts Payable Accrued Expenses Current Portion of LT Debt Other Current Liabilities Current Liabilities Long-Term Debt Bank Term Loan (a) Senior Notes (b) Revolving Credit Facility Capitalized Leases Total LT Debt Pension Liabilities (c) Other LT Liabilities Total Liabilities $26.6 $40.8 $0.0 $33.3 $100.7 $363.1 $294.9 $0.0 $0.2 $658.2 $223.1 $70.2 $1,052.2 $30.0 $40.5 $6.9 $42.4 $119.8 $369.4 $293.9 $26.4 $27.0 $0.0 $0.0 $0.0 $45.1 $98.6 $285.8 $300.0 $0.0 $0.0 $426.0 $430.0 $0.0 $0.0 $663.3 $711.8 $730.0 $170.7 $173.0 $251.2 $62.2 $60.4 $67.1 $1,016.0 $1,043.8 $1,179.0 $41.4 $50.6 $0.0 $38.8 $130.7 $32.7 $52.5 $0.0 $54.9 $140.0 $300.0 $0.0 $597.5 $0.0 $897.5 $147.6 $373.0 $1,558.1 Total Equity Total Liabilities And Equity Other Items: Total Shares Out (millions) Debt-to-Total Capitalization Current Ratio $34.0 $163.9 $192.3 $155.2 $913.0 $1,086.2 $1,179.9 $1,236.0 $1,334.3 $2,471.1 23.1 95.1% 1.46 23.0 80.3% 1.43 22.8 78.7% 2.08 22.8 82.5% 1.32 22.6 49.6% 2.24 Sources: S&P Capital IQ (accessed 9/20/12), and Media General Annual Reports, various years. Notes: a) The Bank Term Loan matured in March 2013 and had a rate of ~ 5.00% (= Libor +4.75%). b) The Senior Notes had a face value of $300 million, a final maturity in February 2017, and an interest rate of 11.75%. c) Includes $132 million for a funded pension plan and $91.1 million for other unfunded pension and benefits plans.
Expert Answer:

Related Book For 
Financial Reporting Financial Statement Analysis and Valuation a strategic perspective
ISBN: 978-1285190907
8th edition
Authors: James M. Wahlen, Stephen P. Baginski, Mark Bradshaw
Posted Date:
Students also viewed these finance questions
-
Managing Scope Changes Case Study Scope changes on a project can occur regardless of how well the project is planned or executed. Scope changes can be the result of something that was omitted during...
-
Read the case study "Southwest Airlines," found in Part 2 of your textbook. Review the "Guide to Case Analysis" found on pp. CA1 - CA11 of your textbook. (This guide follows the last case in the...
-
Show that the ratio of the angular speeds of a pair of coupled gear wheels is in the inverse ratio of their respective radii.
-
What are the major sources of consumer credit?
-
Let H be a subgroup of G. The centralizer of H is the set C G (H) = {g G| hg = gh for all h H}. Show that C G (H) is a subgroup of N G (H).
-
True or False: If MARR \(=10 \%\) and IRR \(=9 \%\), then ERR \( <10 \%\) and \(\mathrm{PW}>\$ 0\).
-
Presented below are two independent situations. Situation A: Chenowith Co. reports revenues of $200,000 and operating expenses of $110,000 in its first year of operations, 2012. Accounts receivable...
-
Let X be a binomial random variable with the probability distribution f(x) shown below. Find the probability distribution of the random variable Y=x. f(x)= Bere 3-x x=0,1,2,3 elsewhere Complete the...
-
Figure 4-32 shows a class list for Millennium College. Convert this user view to a set of 3NF relations using an enterprise key. Assume the following: ¢ An instructor has a unique location....
-
Which statement represents a best practice regarding inputting variable costs into Project? A Create a table that you can use to review and transfer costs to the Resource Sheet. B Enter them into...
-
Findings related to goods that do not meet quality requirements should be recorded and reported. How can they be reported and to whom should they be reported?
-
Describe a skill I would like to improve on as a bookkeeper, and how that would help me become a better bookkeeper and how to find out I will be getting feedback on improvement from my work.
-
An index consists of the following securities. What is the value-weighted index return? Stock Shares Outstanding Beginning Price Ending Price A 1,626 25.97 23.5 B 2,260 82.72 75.78 C 1,943 52.61 61.9...
-
An index consists of the following securities. What is the price-weighted index return? Stock Shares Outstanding Beginning Price Ending Price A 3,401 24.69 27.42 B 900 84.78 76.11 C 2,458 52.1 69.64...
-
What portfolio of call options would you buy to get the Skinny "M" payoff? 10 5 Skinny "M" 8 8 8 86 68 86 8 -- 0 Stock Price
-
The financial statements of Rukavina Corporation follow: Comparative Balance Sheet Ending Balance Beginning Balance Assets: Cash and cash equivalents $ 43 $ 40 Accounts receivable 104 91 Inventory 63...
-
Medi-Exam Health Services, Inc. (MEHS), located in a major metropolitan area, provides annual physical screening examinations, including a routine physical, EKG, and blood and urine tests. MEUS's...
-
Assume that a corporation needs to enter the private debt market to raise funds for plant expansion. The corporation expects debt covenants to place restrictions on the levels of its current ratio...
-
Alpha Computer Systems (ACS) designs, manufactures, sells, and services networked computer systems; associated peripheral equipment; and related network, communications, and software products....
-
Exhibit 7.17 includes a footnote excerpt from the annual report of The Coca-Cola Company for 2004. The beverage company offers stock options to key employees under plans approved by stockholders....
-
a. Find the rank of the given matrix. b. Confirm the result of (a) in MATLAB. 3 5 ST TNT 2 A=1 7
-
Prove that the product of two symmetric matrices is not necessarily symmetric.
-
BAw Perform the indicated operations, if defined, for the following vectors and matrices. -2 1 -3 1 1 A = 1 -3 2 1 32 B = V= W = 0 0 4 5

Study smarter with the SolutionInn App