

Question: Using the given data please provide the information for the writing module. Provide: Period with explanation of how you determined the value. Amplitude with explanation
Using the given data please provide the information for the writing module.
Provide:
- Period with explanation of how you determined the value.
- Amplitude with explanation of how you determined the value.
- Midline with explanation of how you determined the value.
- Tide model with explanation of how you determined the value.
- Graph that shows the 12 semidiurnal Tides and the graph of the equation that best models those 12 semidiurnal Tides.
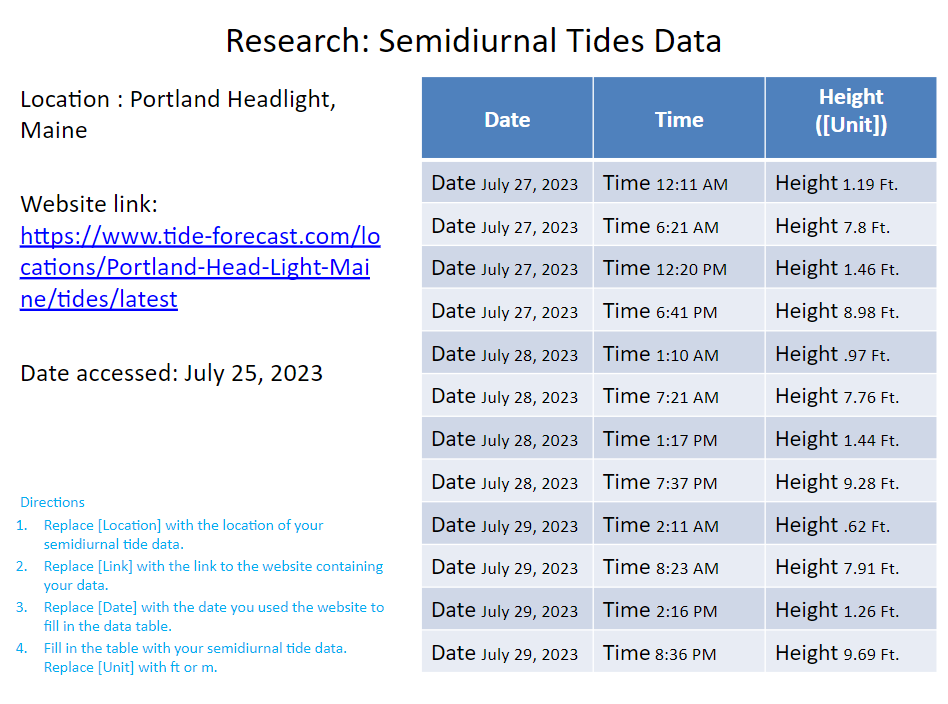
Research: Semidiurnal Tides Data Location : Portland Headlight, Height Date Time Maine ([Unit]) Date July 27, 2023 Time 12:11 AM Height 1.19 Ft. Website link: Height 7.8 Ft. https://www.tide-forecast.com/lo Date July 27, 2023 Time 6:21 AM cations/Portland-Head-Light-Mai Date July 27, 2023 Time 12:20 PM Height 1.46 Ft. ne/tides/latest Date July 27, 2023 Time 6:41 PM Height 8.98 Ft. Date July 28, 2023 Time 1:10 AM Height .97 Ft. Date accessed: July 25, 2023 Date July 28, 2023 Time 7:21 AM Height 7.76 Ft. Date July 28, 2023 Time 1:17 PM Height 1.44 Ft. Date July 28, 2023 Time 7:37 PM Height 9.28 Ft. Directions 1. Replace [Location] with the location of your Date July 29, 2023 Time 2:11 AM Height .62 Ft. semidiurnal tide data. 2. Replace [Link] with the link to the website containing Date July 29, 2023 Time 8:23 AM Height 7.91 Ft. your data. 3. Replace [Date] with the date you used the website to Date July 29, 2023 Time 2:16 PM Height 1.26 Ft. fill in the data table. 4. Fill in the table with your semidiurnal tide data. Date July 29, 2023 Time 8:36 PM Height 9.69 Ft. Replace [Unit] with ft or m.Writing: Graphing the Semidiurnal Tides [ Location] [Graph-Semidiurnal] Directions 1. Replace [Location] with the location of your semidiurnal tides. 2. Replace [Graph-Semidiurnal] with a screenshot of your graph that shows the 12 semidiurnal tides and the graph of your equation that best models those tides.Writing: Modeling the Semidiurnal Tides [Location] Period: [Period] [Explanation] Amplitude: [Amplitude] [ Explanation] Midline: [Midline] [Explanation] Tide Model: [Equation] [Explanation] Directions 1. Replace [Location] with the location of your semidiurnal tides. 2. Replace [Period] and [ Amplitude] with the approximate period and amplitude of your semidiurnal tide data. Replace each [Explanation] with an explanation of how you determined that value. 3. Replace [Midline] with the equation that best approximates the midline of your semidiurnal tide data. Replace the [ Explanation] with an explanation of how you determined that equation. 4. Replace [Equation] with the sinusoidal equation that best models your semidiurnal tide data. Write (pi) for pi. Replace the [Explanation] with an explanation of how you determined that equation
Step by Step Solution
There are 3 Steps involved in it

Get step-by-step solutions from verified subject matter experts