

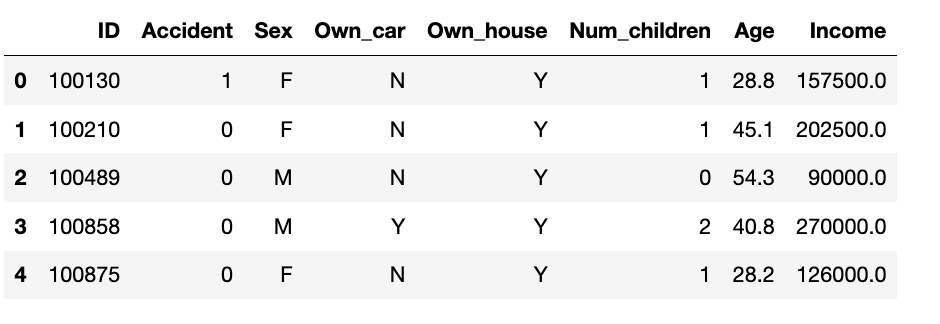
Question: Using the given dataframe in python, draw age density plots for car owners and non car owners in the first panel, then draw age density
Using the given dataframe in python, draw age density plots for car owners and non car owners in the first panel, then draw age density plots for home owners and non home owners in the second panel, as in the figure below.
Step by Step Solution
There are 3 Steps involved in it
1 Expert Approved Answer
Step: 1 Unlock

Question Has Been Solved by an Expert!
Get step-by-step solutions from verified subject matter experts
Step: 2 Unlock
Step: 3 Unlock