

Question: Using the graph and the table in Figure 2.2 (below), please fill in the missing pieces of information that are marked with a question
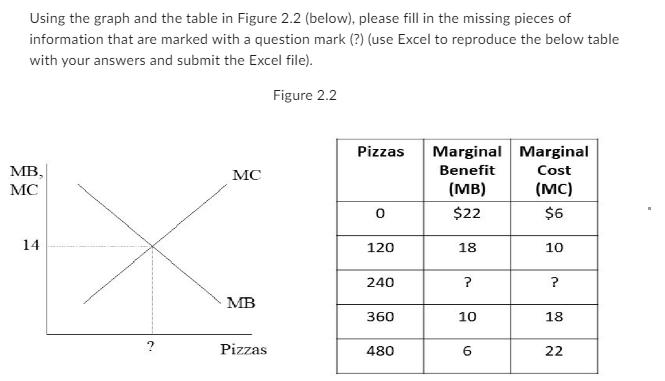
Using the graph and the table in Figure 2.2 (below), please fill in the missing pieces of information that are marked with a question mark (?) (use Excel to reproduce the below table with your answers and submit the Excel file). Figure 2.2 MB, MC 14 MC MB Pizzas Pizzas 0 120 240 360 480 Marginal Marginal Benefit Cost (MB) (MC) $22 $6 18 ? 10 6 10 ? 18 22
Step by Step Solution
3.32 Rating (152 Votes )
There are 3 Steps involved in it
The image youve provided contains a graph representing the Marginal Benefit MB and Marginal Cost MC curves for pizzas and a table that corresponds wit... View full answer

Get step-by-step solutions from verified subject matter experts