

Question: Using the Graph below, answer the questions on page 10: Note: This is a business cycle index which removes the upward trend line and
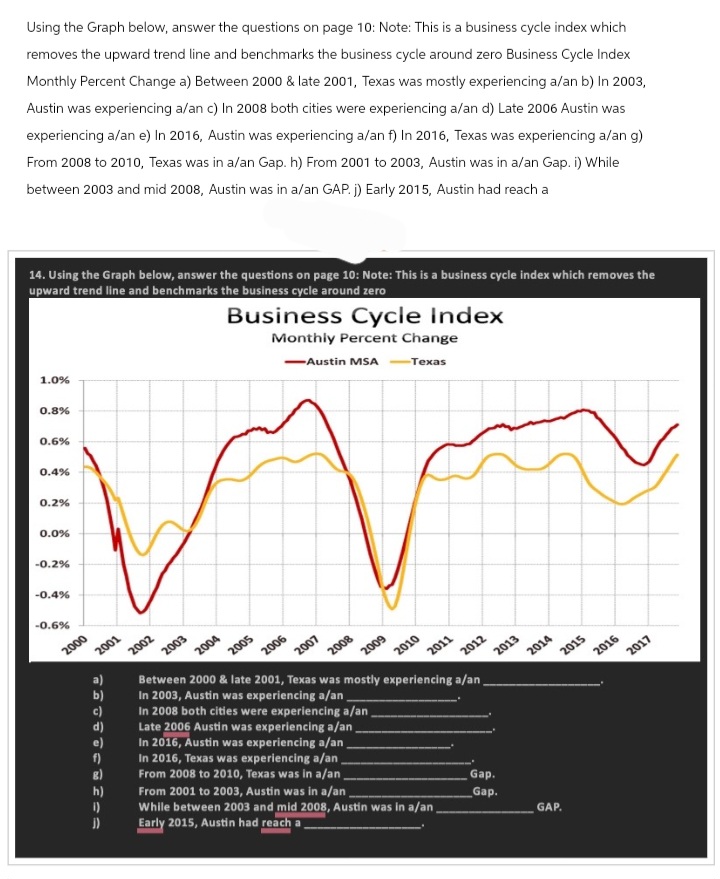
Using the Graph below, answer the questions on page 10: Note: This is a business cycle index which removes the upward trend line and benchmarks the business cycle around zero Business Cycle Index Monthly Percent Change a) Between 2000 & late 2001, Texas was mostly experiencing a/an b) In 2003, Austin was experiencing a/an c) In 2008 both cities were experiencing a/an d) Late 2006 Austin was experiencing a/an e) In 2016, Austin was experiencing a/an f) In 2016, Texas was experiencing a/an g) From 2008 to 2010, Texas was in a/an Gap. h) From 2001 to 2003, Austin was in a/an Gap. i) While between 2003 and mid 2008, Austin was in a/an GAP. j) Early 2015, Austin had reach a 14. Using the Graph below, answer the questions on page 10: Note: This is a business cycle index which removes the upward trend line and benchmarks the business cycle around zero Business Cycle Index Monthly Percent Change -Austin MSA Texas 1.0% 0.8% 0.6% 0.4% 0.2% 0.0% -0.2% -0.4% -0.6% 2000 2001 2002 2003 2004 2005 2006 2007 2008 2009 Between 2000 & late 2001, Texas was mostly experiencing a/an In 2003, Austin was experiencing a/an In 2008 both cities were experiencing a/an, Late 2006 Austin was experiencing a/an. In 2016, Austin was experiencing a/an In 2016, Texas was experiencing a/an 2010 2011 2012 2013 2014 2015 2016 2017 b) d) e) g) From 2008 to 2010, Texas was in a/an Gap. h) From 2001 to 2003, Austin was in a/an, Gap. 1) While between 2003 and mid 2008, Austin was in a/an GAP. }) Early 2015, Austin had reach a
Step by Step Solution
There are 3 Steps involved in it

Get step-by-step solutions from verified subject matter experts