

Question: Using the graph below, label the following areas by circling the red triangles where: 1.There is too much WIP 2.There is too little WIP 3.WIP
Using the graph below, label the following areas by circling the red triangles where:
1.There is too much WIP
2.There is too little WIP
3.WIP is just right
Then match each of the scenarios above with one of the following descriptions of results caused by the level of WIP:
A.Bottleneck is starved causing lost throughput
B.Cycle times are long because things are waiting in line
C.Getting towards the ideal of Maximum Throughput with Minimum Cycle Time
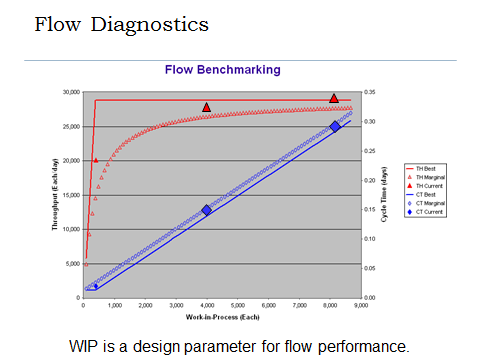
Flow Diagnostics Flow Benchmarking 25000 20 080 - THBAL Cyde Time (days) - CT Dell Throughput Each day 1500 & CT Marginal 10 00 6.10 1000 3,000 Work In Process (Each) WIP is a design parameter for flow performance
Step by Step Solution
There are 3 Steps involved in it

Get step-by-step solutions from verified subject matter experts