

Question: Using the graph below, please plot log aT vs. T(C), using 140C as the reference temperature. 200 Epoxy-Amine Cure 180 DGEBA-PACM-20 (1:1) Tgx =
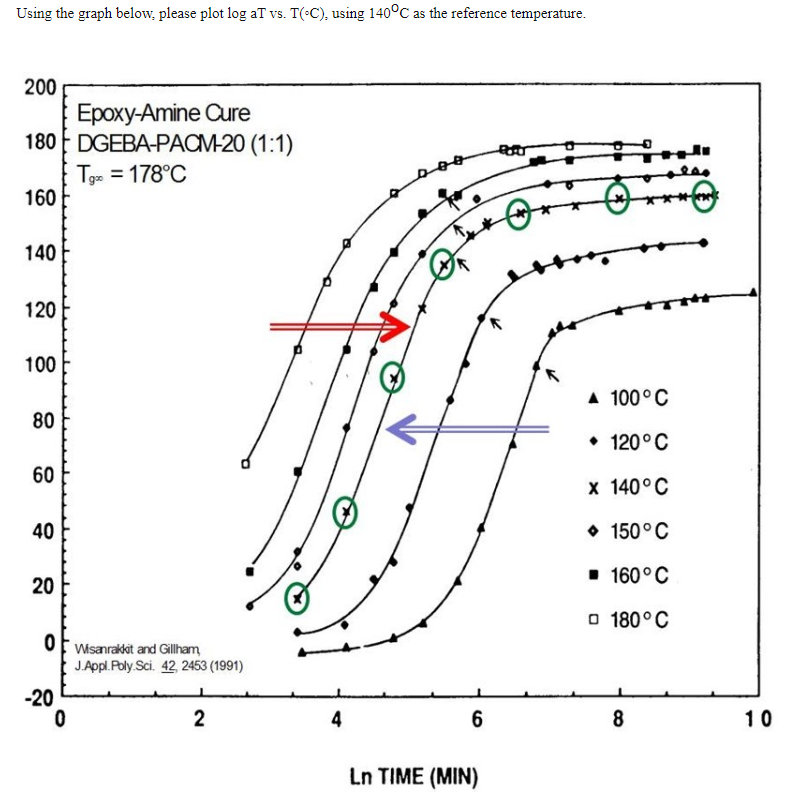
Using the graph below, please plot log aT vs. T(C), using 140C as the reference temperature. 200 Epoxy-Amine Cure 180 DGEBA-PACM-20 (1:1) Tgx = 178C 160 140 120 100 80 80 60 60 40 40 20 20 Wisanrakkit and Gillham, J. Appl. Poly Sci. 42, 2453 (1991) 0 -20 0 2 4 *** 100C 120C 140C 150C 160C 180C 6 8 10 Ln TIME (MIN)
Step by Step Solution
There are 3 Steps involved in it
1 Expert Approved Answer
Step: 1 Unlock

Question Has Been Solved by an Expert!
Get step-by-step solutions from verified subject matter experts
Step: 2 Unlock
Step: 3 Unlock