

Question: Using the graph below, where wage rate increases from $10 to $30, provide a step by step analysis of the 1. workers intial optimality point,
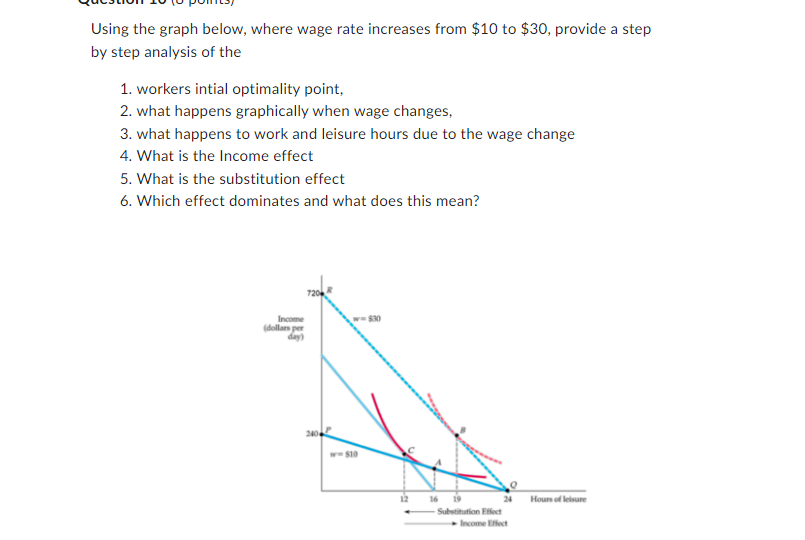
Using the graph below, where wage rate increases from $10 to $30, provide a step by step analysis of the 1. workers intial optimality point, 2. what happens graphically when wage changes, 3. what happens to work and leisure hours due to the wage change 4. What is the Income effect 5. What is the substitution effect 6. Which effect dominates and what does this mean? Using the graph below, where wage rate increases from $10 to $30, provide a step by step analysis of the 1. workers intial optimality point, 2. what happens graphically when wage changes, 3. what happens to work and leisure hours due to the wage change 4. What is the Income effect 5. What is the substitution effect 6. Which effect dominates and what does this mean
Step by Step Solution
There are 3 Steps involved in it

Get step-by-step solutions from verified subject matter experts