

Question: Using the graph, shift the short-run aggregate supply (AS) curve or the aggregate demand (AD) curve to show the short-run impact of the increase

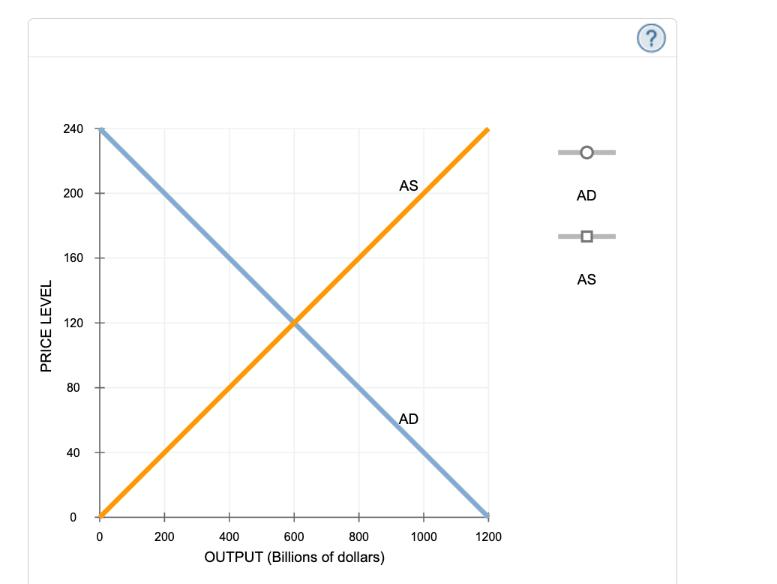
Using the graph, shift the short-run aggregate supply (AS) curve or the aggregate demand (AD) curve to show the short-run impact of the increase in government spending. PRICE LEVEL 240 200 160 120 80 40 0 0 200 400 600 800 OUTPUT (Billions of dollars) AS AD 1000 1200 AD 0 AS (?)
Step by Step Solution
There are 3 Steps involved in it
1 Expert Approved Answer
Step: 1 Unlock

From the Image attached below it can be observed that in the short ... View full answer
Question Has Been Solved by an Expert!
Get step-by-step solutions from verified subject matter experts
Step: 2 Unlock
Step: 3 Unlock