

Question: Using the graph shown below, answer the following questions: a. What was the equilibrium price and quantity in this market before the tax? b. What
Using the graph shown below, answer the following questions:
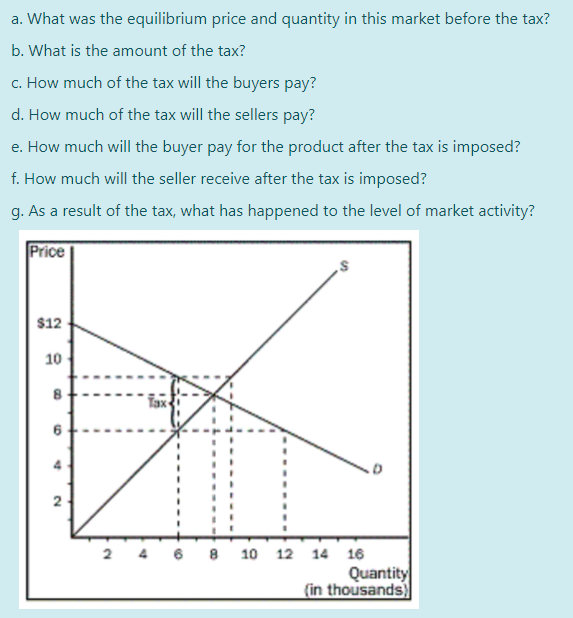
a. What was the equilibrium price and quantity in this market before the tax? b. What is the amount of the tax? C. How much of the tax will the buyers pay? d. How much of the tax will the sellers pay? e. How much will the buyer pay for the product after the tax is imposed? f. How much will the seller receive after the tax is imposed? g. As a result of the tax, what has happened to the level of market activity? Price $12 10 B 6 2 6 8 10 12 14 16 Quantity (in thousands)
Step by Step Solution
There are 3 Steps involved in it
1 Expert Approved Answer
Step: 1 Unlock

Question Has Been Solved by an Expert!
Get step-by-step solutions from verified subject matter experts
Step: 2 Unlock
Step: 3 Unlock