Using the Graphviz library and in pandas and jupyternotebook this is the dataset values this is the
Question:
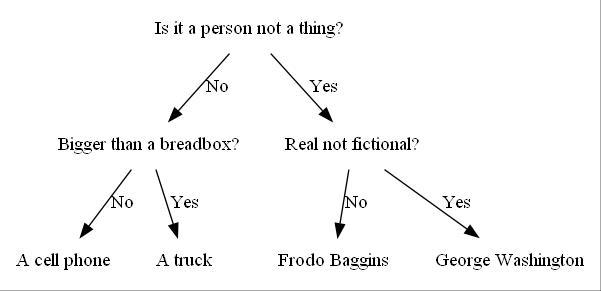
Using the Graphviz library and in pandas and jupyternotebook this is the dataset values
this is the output required
however this is my code but i am getting error and need help with it
code below
import pandas as pd
from graphviz import Digraph
# Load the data
#df = pd.read_csv("dataframe.csv")
df = pd.read_csv('dataframe.csv', index_col = "ID") # df is "data frame"
#replace all occurances of "Not A Number" (NaN) with "Nothing" (None)
df.replace({float("nan"): None}, inplace=True)
# Create the graph
graph = Digraph(format='jpg')
# Create Nodes for all entries in dataframe
nodeMap = {None:None}
#process your data frame from the bottom up
print("Creating Nodes for Tree")
for index in reversed(df.index.values):
#print("Creating Node for: ",index)
nodeMap[index] = Node(df.loc[index]["Label"],nodeMap[df.loc[index]["Left Child"]],nodeMap[df.loc[index]["Right Child"]]) - NameError: name 'Node' is not defined
Expert Answer:
The suggested code is as follows In this code several modifications are made and they incl... View the full answer