

Question: Using the information below, construct a strategic group map. Make a sketch of your SGM on paper. Then photograph and post your work OR Create
Using the information below, construct a strategic group map.
Make a sketch of your SGM on paper. Then photograph and post your work
OR
Create your SGM using PPT or Word.
Pizza Industry Definition The pizza industry includes producers or assemblers of pizza for sale, then relatively immediate consumption in full pie/trays to consumers in the United States. Included are companies for which the sale of pizza is the primary source of revenue. Companies that produce primarily frozen pizza are excluded as are grocery stores and food courts.
TO COMPLETE:
Draw an X/Y axis
Choose two Dimensions to pair from the list or create dimension(s) of your own
Use dimensions related to industry or company, rather than product (pizza)
Assign one dimension to each axis
Add the measures and mark the scale on the axis
Measure for each company
Place circle, sized to proportion of total revenues at intersection of measures for the company
Rather than overlap circles with similar or same measures, place them next to each other
Evaluate placement
Add segment lines
Label empty industry areas
Add items to enhance readability
Color or texture change to denote company of focus (your company)
Labels or key for companies
Segment names
Meaning for measurements
Title for overall SGM
Evaluate placement
Add segment lines
Label empty industry areas
Add items to enhance readability
Color or texture change to denote company of focus (your company)
Labels or key for companies
Segment names
Meaning for measurements
Title for overall SGM
Include a short discussion of what you think the SGM reveals
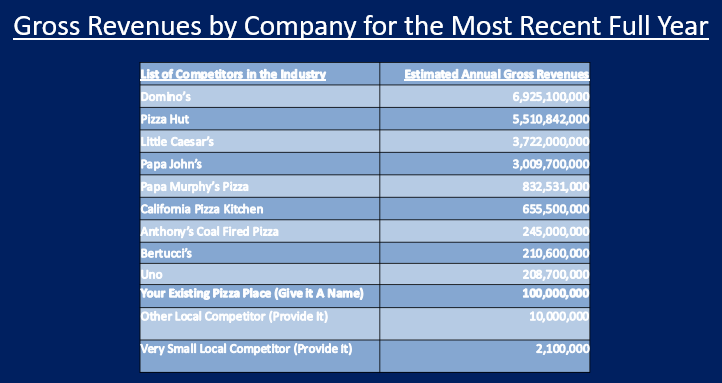
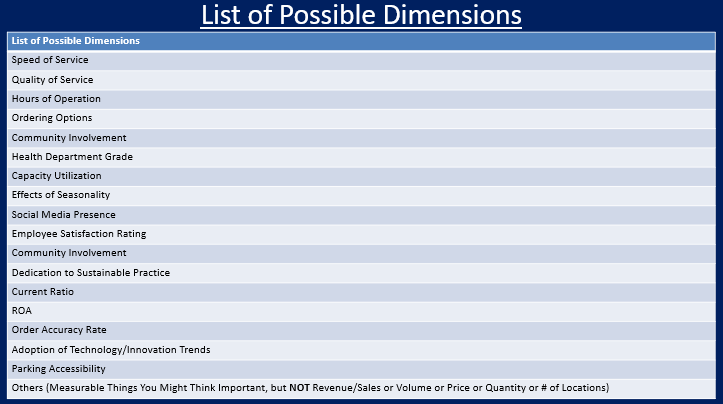
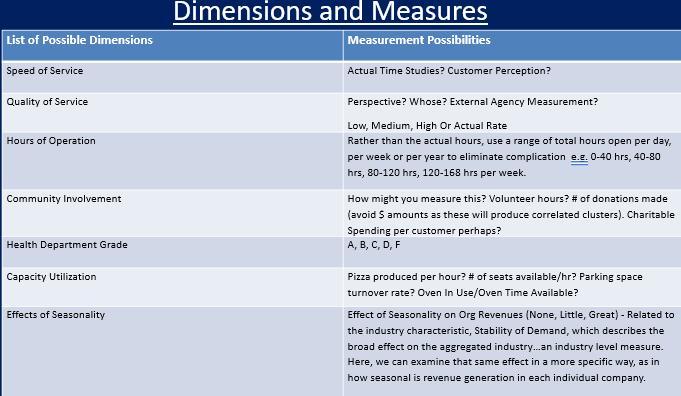
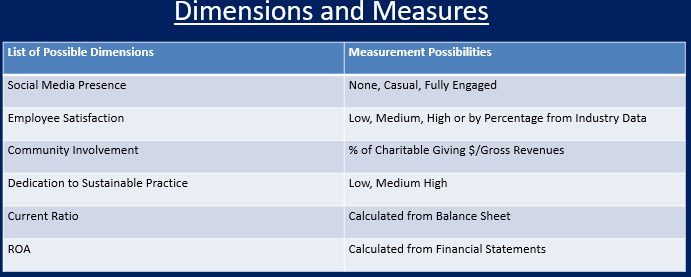
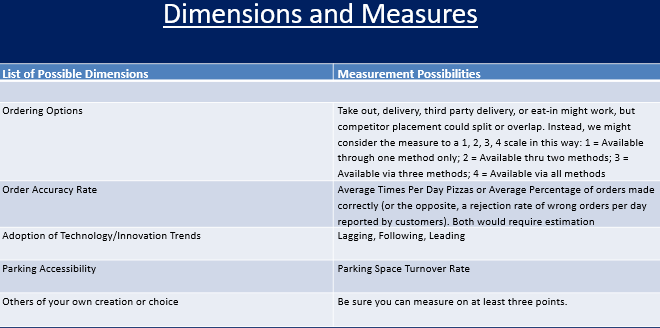
Gross Revenues by Company for the Most Recent Full Year List of Competitors in the Industry Domino's Pizza Hut Little Caesar's Papa John's Papa Murphy's Pizza California Pizza Kitchen Anthony's Coal Fired Pizza Bertucci's Uno Your Existing Pizza Place (Give it A Name) Other Local Competitor (Provide it) Estimated Annual Gross Revenues 6,925,100,000 5,510,842,000 3,722,000,000 3,009,700,000 832,531,000 655,500,000 245,000,000 210,600,000 208,700,000 100,000,000 10,000,000 Very Small Local Competitor (Provide it) 2,100,000 List of Possible Dimensions List of Possible Dimensions Speed of Service Quality of Service Hours of Operation Ordering Options Community Involvement Health Department Grade Capacity Utilization Effects of Seasonality Social Media Presence Employee Satisfaction Rating Community Involvement Dedication to Sustainable Practice Current Ratio ROA Order Accuracy Rate Adoption of Technology/Innovation Trends Parking Accessibility Others (Measurable Things You Might Think Important, but NOT Revenue/Sales or Volume or Price or Quantity or # of Locations) Dimensions and Measures Measurement Possibilities List of Possible Dimensions Speed of Service Actual Time Studies? Customer Perception? Quality of Service Hours of Operation Perspective? Whose? External Agency Measurement? Low, Medium, High Or Actual Rate Rather than the actual hours, use a range of total hours open per day, per week or per year to eliminate complication e.e. 0-40 hrs, 40-80 hrs, 80-120 hrs, 120-168 hrs per week. How might you measure this? Volunteer hours? # of donations made (avoid 5 amounts as these will produce correlated clusters). Charitable Spending per customer perhaps? A, B, C, D, F Community Involvement Health Department Grade Capacity Utilization Effects of Seasonality Pizza produced per hour? # of seats available/hr? Parking space turnover rate? Oven In Use/Oven Time Available? Effect of Seasonality on Org Revenues (None, Little, Great) - Related to the industry characteristic, Stability of Demand, which describes the broad effect on the aggregated industry...an industry level measure. Here, we can examine that same effect in a more specific way, as in how seasonal is revenue generation in each individual company. Dimensions and Measures List of Possible Dimensions Measurement Possibilities Social Media Presence None, Casual, Fully Engaged Employee Satisfaction Low, Medium, High or by Percentage from Industry Data Community Involvement % of Charitable Giving $/Gross Revenues Dedication to Sustainable Practice Low, Medium High Current Ratio Calculated from Balance Sheet ROA Calculated from Financial Statements Dimensions and Measures List of Possible Dimensions Measurement possibilities Ordering Options Take out, delivery, third party delivery, or eat-in might work, but competitor placement could split or overlap. Instead, we might consider the measure to a 1, 2, 3, 4 scale in this way: 1 = Available through one method only; 2 = Available thru two methods; 3 = Available via three methods; 4 = Available via all methods Average Times Per Day Pizzas or Average Percentage of orders made correctly (or the opposite, a rejection rate of wrong orders per day reported by customers). Both would require estimation Lagging, Following, Leading Order Accuracy Rate Adoption of Technology/Innovation Trends Parking Accessibility Parking Space Turnover Rate Others of your own creation or choice Be sure you can measure on at least three pointsStep by Step Solution
There are 3 Steps involved in it

Get step-by-step solutions from verified subject matter experts