

Question: Using the information below, perform a stock valuation using: a) Two-Stage Growth Model Dividend Discount Model b) Terminal Value = (FCF X [1 + g])
Using the information below, perform a stock valuation using:
a) Two-Stage Growth Model Dividend Discount Model
b) Terminal Value = (FCF X [1 + g]) / (WACC g)
c) Price to Sales Ratio
![g]) / (WACC g) c) Price to Sales Ratio DIVIDEND HISTORY Add](https://dsd5zvtm8ll6.cloudfront.net/si.experts.images/questions/2024/10/66fd63806f635_11166fd637fe80ae.jpg)
DIVIDEND HISTORY
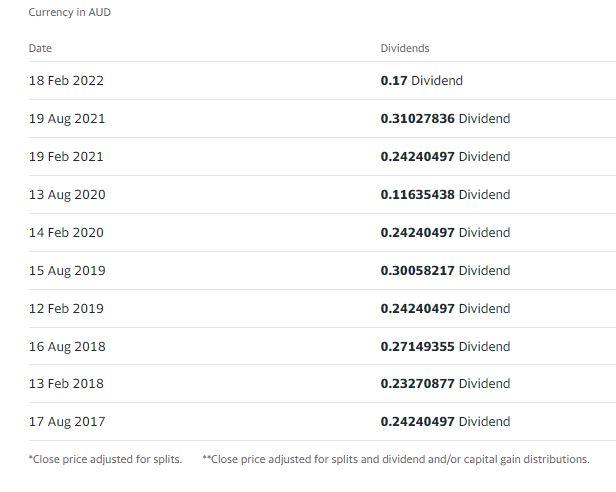
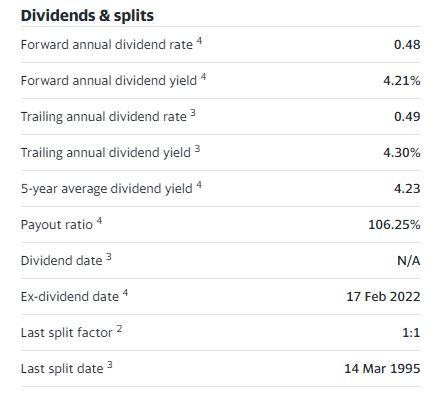
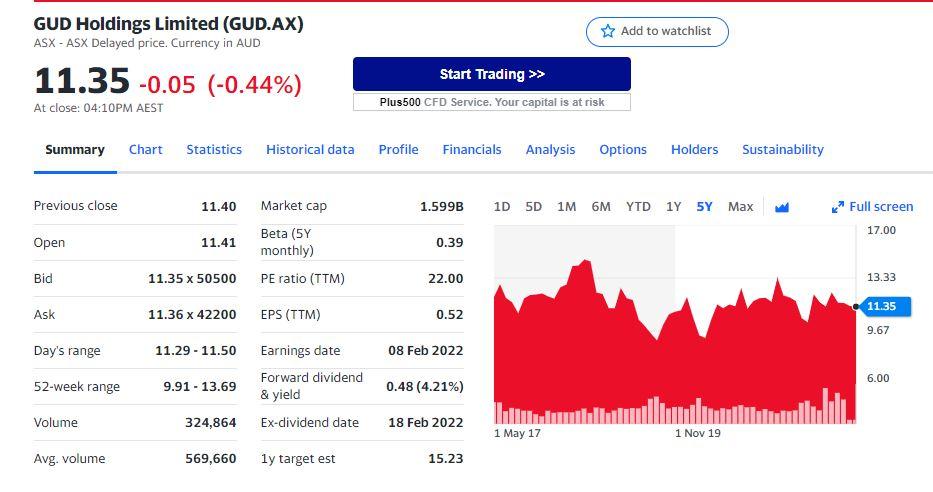
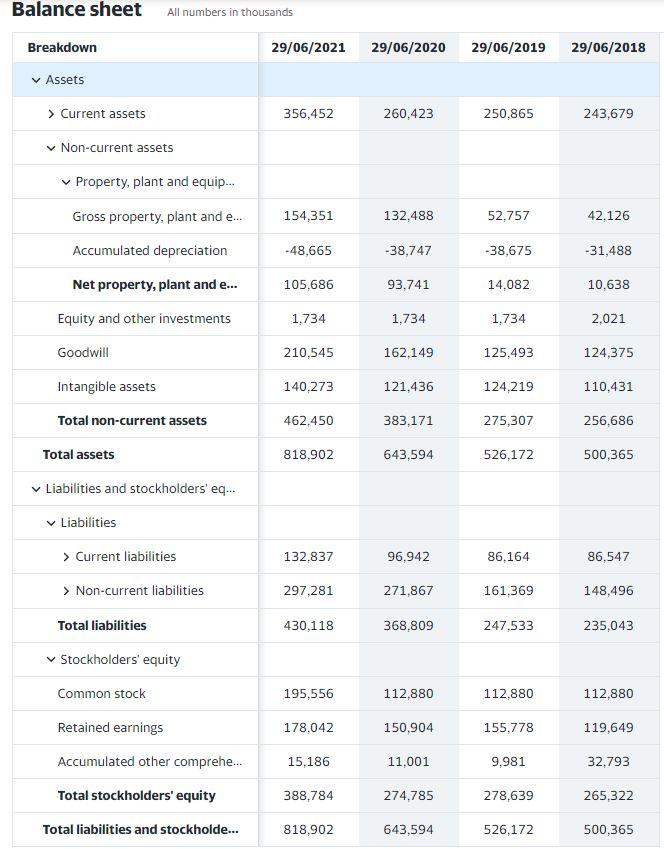
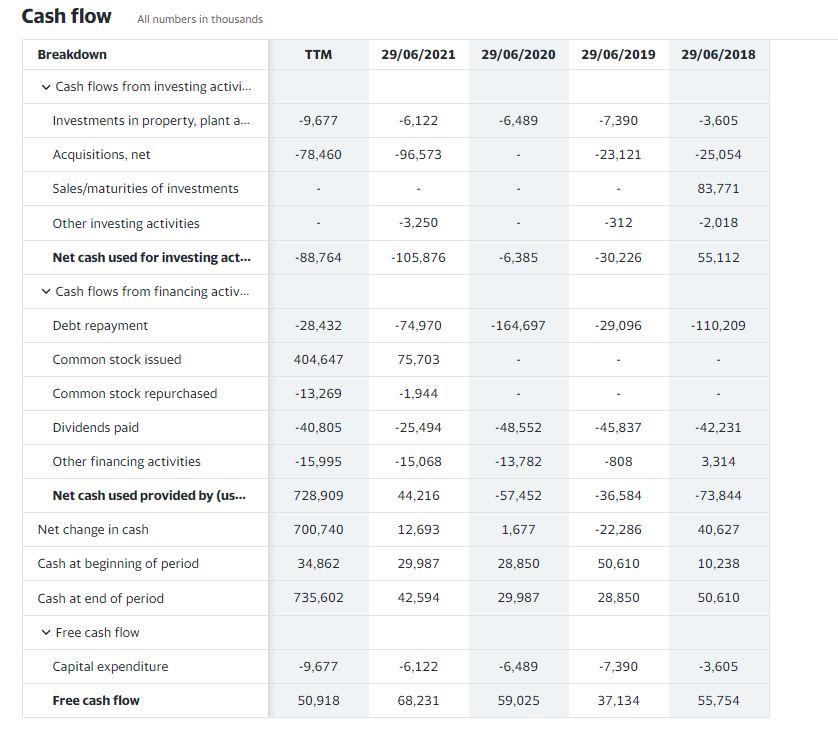
Add to watchlist GUD Holdings Limited (GUD.AX) ASX - ASX Delayed price. Currency in AUD 11.35 -0.05 (-0.44%) At close: 04:10PM AEST Start Trading >> Plus500 CFD Service. Your capital is at risk Summary Chart Statistics Historical data Profile Financials Analysis Options Holders Sustainability Previous close 11.40 1.599B 1D 5D IM 6M YTD 1Y SY Max k" Full screen 17.00 Open 11.41 Market cap Beta (5Y monthly) PE ratio (TTM) 0.39 Bid 11.35 x 50500 22.00 13.33 11.35 Ask 11.36 x 42200 EPS (TTM) 0.52 9.67 Day's range 11.29 - 11.50 08 Feb 2022 Earnings date Forward dividend & yield 6.00 52-week range 9.91 - 13.69 0.48 (4.21%) Volume 324,864 Ex-dividend date 18 Feb 2022 1 May 17 1 Nov 19 Avg. volume 569,660 ly target est 15.23 Balance sheet All numbers in thousands Breakdown 29/06/2021 29/06/2020 29/06/2019 29/06/2018 Assets > Current assets 356,452 260,423 250,865 243,679 Non-current assets Property, plant and equip... Gross property, plant and ... 154,351 132,488 52,757 42.126 Accumulated depreciation -48,665 -38,747 -38,675 -31,488 Net property, plant and e... 105,686 93,741 14.082 10,638 Equity and other investments 1,734 1.734 1.734 2,021 Goodwill 210,545 162,149 125,493 124,375 Intangible assets 140,273 121,436 124,219 110,431 Total non-current assets 462,450 383,171 275,307 256.686 Total assets 818,902 643,594 526,172 500,365 Liabilities and stockholders' eq.... Liabilities > Current liabilities 132,837 96,942 86,164 86,547 > Non-current liabilities 297,281 271,867 161.369 148,496 Total liabilities 430.118 368,809 247,533 235,043 Stockholders' equity Common stock 195,556 112,880 112.880 112,880 Retained earnings 178,042 150,904 155,778 119,649 15,186 11.001 9.981 32,793 Accumulated other comprehe... Total stockholders' equity 388,784 274.785 278,639 265.322 Total liabilities and stockholde... 818,902 643,594 526,172 500,365 Income statement All numbers in thousands TTM 29/06/2021 29/06/2020 29/06/2019 29/06/2018 Breakdown Total revenue 637,535 556,982 438,016 434,077 396,689 Cost of revenue 356,834 310,475 234,981 222.092 200,580 Gross profit 280.701 246,507 203,035 211,985 196,109 Operating expenses Selling general and administrative 155,795 132,323 113,254 111,932 100,267 Total operating expenses 211.612 171,130 145,629 128,736 117,585 69.089 75,377 57,406 83,249 78,524 Operating income or loss Interest expense 6.189 7,091 7.348 6,918 6,792 Total other income/expenses net 928 3.408 1.855 490 -5,563 Income before tax 81,887 86,974 63.647 80,245 70.196 Income tax expense 28,026 26.008 19,969 20,687 19.723 Income from continuing operations 53,861 60,966 43,678 59,558 50,473 Net income 53,861 60.966 43,678 59,558 101,845 Net income available to common s... 53,861 60,966 43,678 59,558 101,845 Basic EPS 0.65 0.49 0.67 1.15 Diluted EPS 0.64 0.48 0.66 1.14 Basic average shares 93,792 89,399 89.196 88,848 Diluted average shares 94.551 90,093 89.801 89.621 EBITDA 112.636 85,995 90.461 80.883 Cash flow All numbers in thousands Breakdown TTM 29/06/2021 29/06/2020 29/06/2019 29/06/2018 Cash flows from investing activi... Investments in property, plant a... -9,677 -6,122 -6,489 -7,390 -3,605 -78,460 -96,573 -23,121 -25,054 Acquisitions, net Sales/maturities of investments 83,771 -3,250 -312 -2,018 Other investing activities Net cash used for investing act... Cash flows from financing activ... -88,764 -105,876 -6,385 -30,226 55,112 Debt repayment -28,432 -74,970 -164,697 -29,096 -110,209 Common stock issued 404,647 75,703 Common stock repurchased -13,269 -1.944 Dividends paid -40,805 -25,494 -48,552 -45,837 -42,231 Other financing activities -15,995 -15,068 -13,782 -808 3.314 728,909 44,216 -57,452 -36,584 -73,844 Net cash used provided by (us... Net change in cash 700,740 12.693 1,677 -22,286 40,627 Cash at beginning of period 34,862 29.987 28,850 50,610 10.238 Cash at end of period 735,602 42,594 29.987 28.850 50.610 Free cash flow Capital expenditure -9,677 -6,122 -6,489 -7,390 -3,605 Free cash flow 50,918 68.231 59,025 37,134 55,754 Currency in AUD Date Dividends 18 Feb 2022 0.17 Dividend 19 Aug 2021 0.31027836 Dividend 19 Feb 2021 0.24240497 Dividend 13 Aug 2020 0.11635438 Dividend 14 Feb 2020 0.24240497 Dividend 15 Aug 2019 0.30058217 Dividend 12 Feb 2019 0.24240497 Dividend 16 Aug 2018 0.27149355 Dividend 13 Feb 2018 0.23270877 Dividend 17 Aug 2017 0.24240497 Dividend *Close price adjusted for splits. **Close price adjusted for splits and dividend and/or capital gain distributions. Dividends & splits Forward annual dividend rate 4 0.48 Forward annual dividend yield 4 4.21% Trailing annual dividend rate 3 0.49 Trailing annual dividend yield 3 4.30% % 5-year average dividend yield 4 4.23 Payout ratio 4 106.25% Dividend date 3 N/A Ex-dividend date 4 17 Feb 2022 Last split factor 2 1:1 1 3 Last split date 14 Mar 1995 Add to watchlist GUD Holdings Limited (GUD.AX) ASX - ASX Delayed price. Currency in AUD 11.35 -0.05 (-0.44%) At close: 04:10PM AEST Start Trading >> Plus500 CFD Service. Your capital is at risk Summary Chart Statistics Historical data Profile Financials Analysis Options Holders Sustainability Previous close 11.40 1.599B 1D 5D IM 6M YTD 1Y SY Max k" Full screen 17.00 Open 11.41 Market cap Beta (5Y monthly) PE ratio (TTM) 0.39 Bid 11.35 x 50500 22.00 13.33 11.35 Ask 11.36 x 42200 EPS (TTM) 0.52 9.67 Day's range 11.29 - 11.50 08 Feb 2022 Earnings date Forward dividend & yield 6.00 52-week range 9.91 - 13.69 0.48 (4.21%) Volume 324,864 Ex-dividend date 18 Feb 2022 1 May 17 1 Nov 19 Avg. volume 569,660 ly target est 15.23 Balance sheet All numbers in thousands Breakdown 29/06/2021 29/06/2020 29/06/2019 29/06/2018 Assets > Current assets 356,452 260,423 250,865 243,679 Non-current assets Property, plant and equip... Gross property, plant and ... 154,351 132,488 52,757 42.126 Accumulated depreciation -48,665 -38,747 -38,675 -31,488 Net property, plant and e... 105,686 93,741 14.082 10,638 Equity and other investments 1,734 1.734 1.734 2,021 Goodwill 210,545 162,149 125,493 124,375 Intangible assets 140,273 121,436 124,219 110,431 Total non-current assets 462,450 383,171 275,307 256.686 Total assets 818,902 643,594 526,172 500,365 Liabilities and stockholders' eq.... Liabilities > Current liabilities 132,837 96,942 86,164 86,547 > Non-current liabilities 297,281 271,867 161.369 148,496 Total liabilities 430.118 368,809 247,533 235,043 Stockholders' equity Common stock 195,556 112,880 112.880 112,880 Retained earnings 178,042 150,904 155,778 119,649 15,186 11.001 9.981 32,793 Accumulated other comprehe... Total stockholders' equity 388,784 274.785 278,639 265.322 Total liabilities and stockholde... 818,902 643,594 526,172 500,365 Income statement All numbers in thousands TTM 29/06/2021 29/06/2020 29/06/2019 29/06/2018 Breakdown Total revenue 637,535 556,982 438,016 434,077 396,689 Cost of revenue 356,834 310,475 234,981 222.092 200,580 Gross profit 280.701 246,507 203,035 211,985 196,109 Operating expenses Selling general and administrative 155,795 132,323 113,254 111,932 100,267 Total operating expenses 211.612 171,130 145,629 128,736 117,585 69.089 75,377 57,406 83,249 78,524 Operating income or loss Interest expense 6.189 7,091 7.348 6,918 6,792 Total other income/expenses net 928 3.408 1.855 490 -5,563 Income before tax 81,887 86,974 63.647 80,245 70.196 Income tax expense 28,026 26.008 19,969 20,687 19.723 Income from continuing operations 53,861 60,966 43,678 59,558 50,473 Net income 53,861 60.966 43,678 59,558 101,845 Net income available to common s... 53,861 60,966 43,678 59,558 101,845 Basic EPS 0.65 0.49 0.67 1.15 Diluted EPS 0.64 0.48 0.66 1.14 Basic average shares 93,792 89,399 89.196 88,848 Diluted average shares 94.551 90,093 89.801 89.621 EBITDA 112.636 85,995 90.461 80.883 Cash flow All numbers in thousands Breakdown TTM 29/06/2021 29/06/2020 29/06/2019 29/06/2018 Cash flows from investing activi... Investments in property, plant a... -9,677 -6,122 -6,489 -7,390 -3,605 -78,460 -96,573 -23,121 -25,054 Acquisitions, net Sales/maturities of investments 83,771 -3,250 -312 -2,018 Other investing activities Net cash used for investing act... Cash flows from financing activ... -88,764 -105,876 -6,385 -30,226 55,112 Debt repayment -28,432 -74,970 -164,697 -29,096 -110,209 Common stock issued 404,647 75,703 Common stock repurchased -13,269 -1.944 Dividends paid -40,805 -25,494 -48,552 -45,837 -42,231 Other financing activities -15,995 -15,068 -13,782 -808 3.314 728,909 44,216 -57,452 -36,584 -73,844 Net cash used provided by (us... Net change in cash 700,740 12.693 1,677 -22,286 40,627 Cash at beginning of period 34,862 29.987 28,850 50,610 10.238 Cash at end of period 735,602 42,594 29.987 28.850 50.610 Free cash flow Capital expenditure -9,677 -6,122 -6,489 -7,390 -3,605 Free cash flow 50,918 68.231 59,025 37,134 55,754 Currency in AUD Date Dividends 18 Feb 2022 0.17 Dividend 19 Aug 2021 0.31027836 Dividend 19 Feb 2021 0.24240497 Dividend 13 Aug 2020 0.11635438 Dividend 14 Feb 2020 0.24240497 Dividend 15 Aug 2019 0.30058217 Dividend 12 Feb 2019 0.24240497 Dividend 16 Aug 2018 0.27149355 Dividend 13 Feb 2018 0.23270877 Dividend 17 Aug 2017 0.24240497 Dividend *Close price adjusted for splits. **Close price adjusted for splits and dividend and/or capital gain distributions. Dividends & splits Forward annual dividend rate 4 0.48 Forward annual dividend yield 4 4.21% Trailing annual dividend rate 3 0.49 Trailing annual dividend yield 3 4.30% % 5-year average dividend yield 4 4.23 Payout ratio 4 106.25% Dividend date 3 N/A Ex-dividend date 4 17 Feb 2022 Last split factor 2 1:1 1 3 Last split date 14 Mar 1995
Step by Step Solution
There are 3 Steps involved in it

Get step-by-step solutions from verified subject matter experts