

Question: Using the information below, perform a valuation using: a) free cash flow model b) dividend discount method, and c) a price ratio method CASH FLOW
Using the information below, perform a valuation using:
a) free cash flow model
b) dividend discount method, and
c) a price ratio method
CASH FLOW
DIVIDEND HISTORY
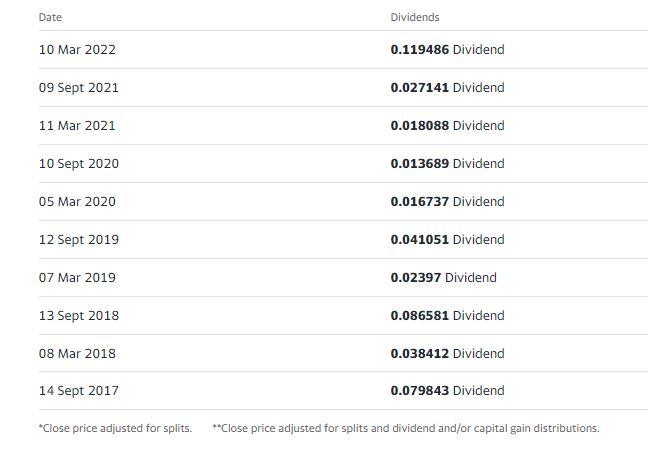
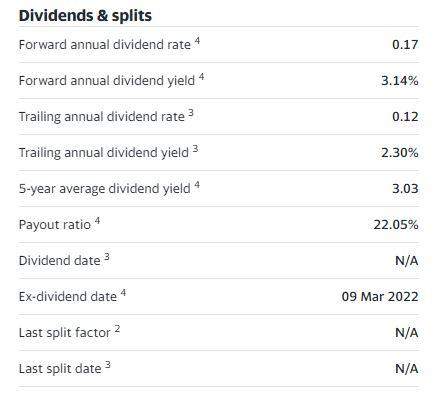
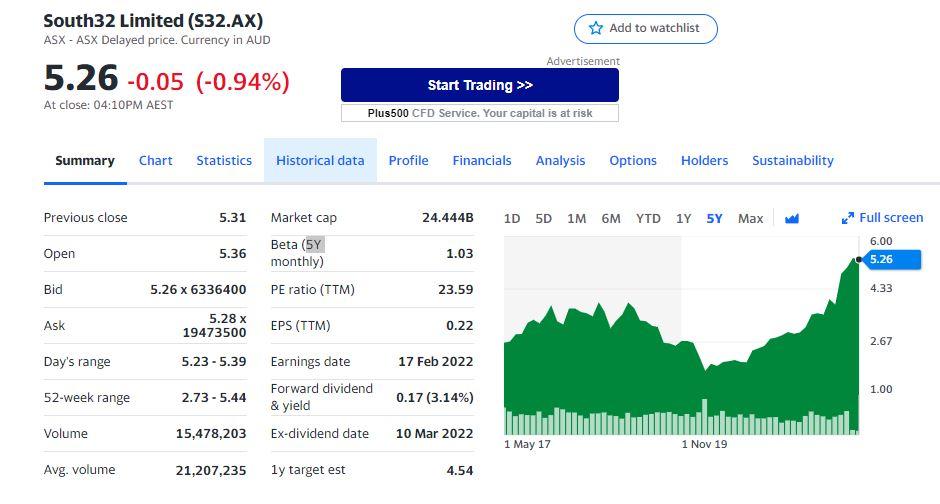
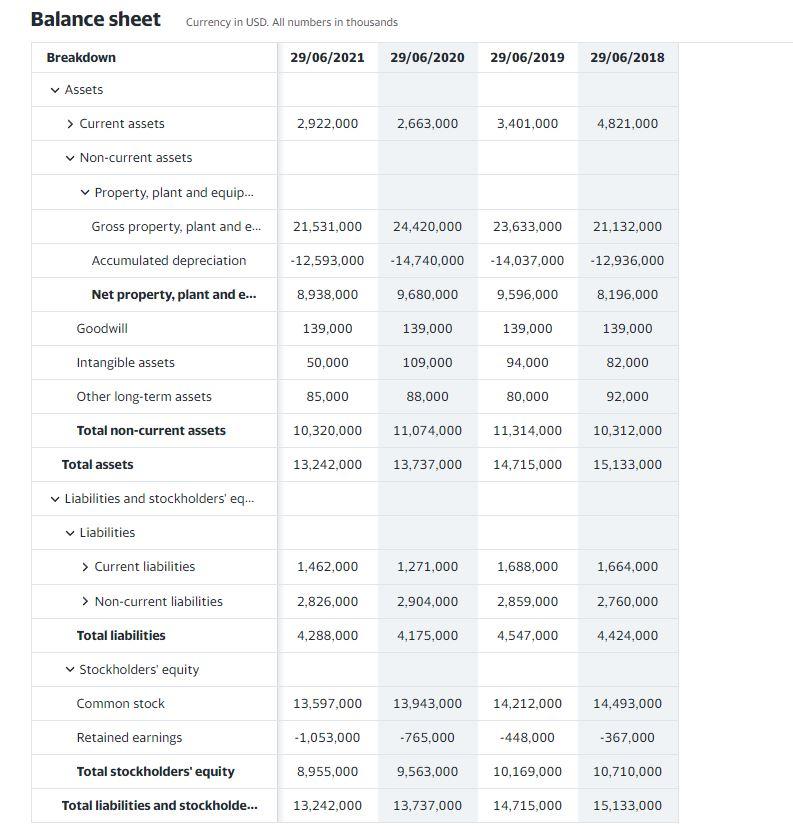
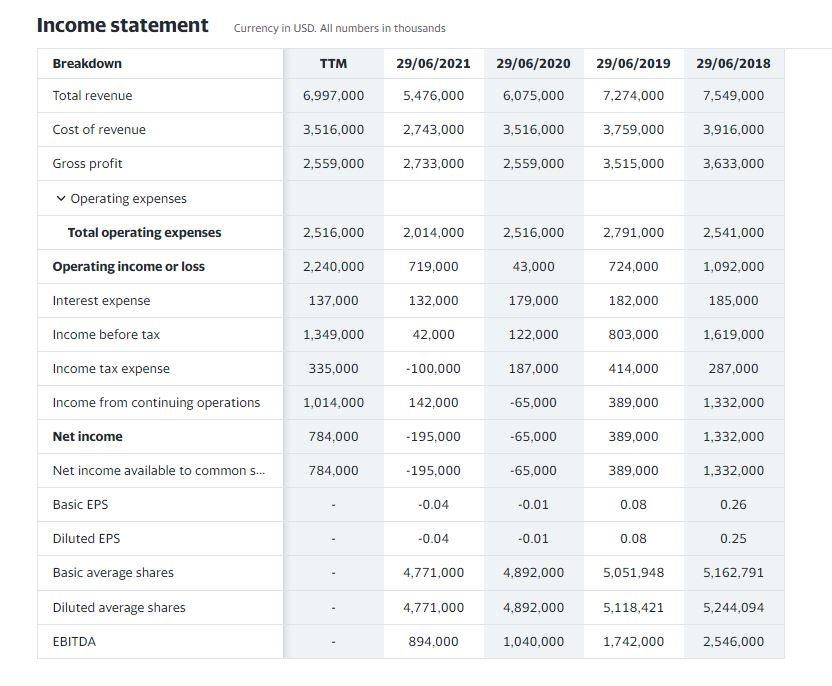
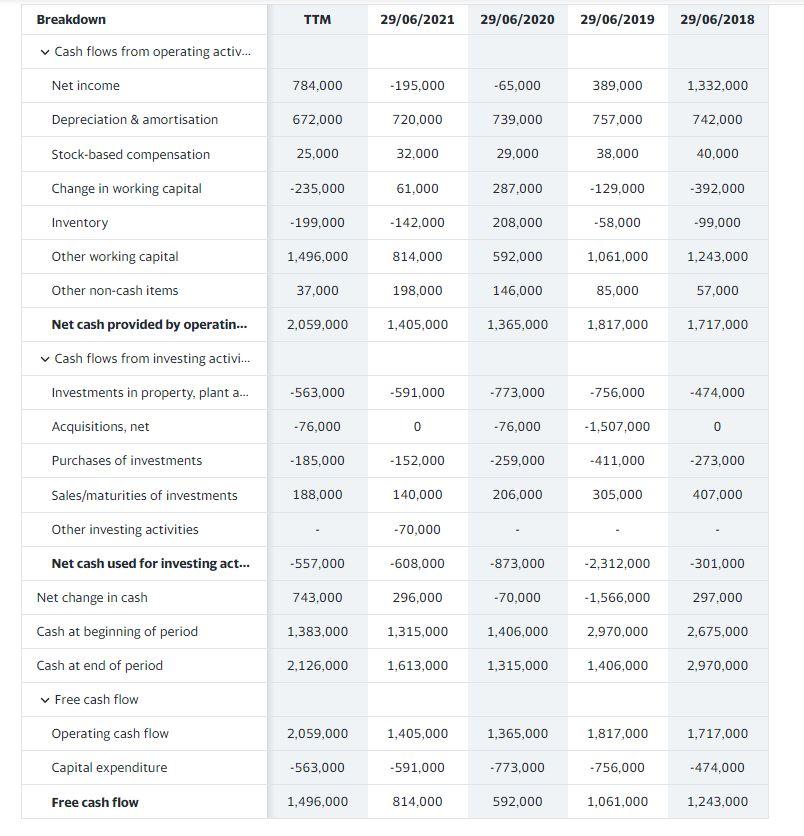
Add to watchlist South32 Limited (532.AX) ASX - ASX Delayed price. Currency in AUD 5.26 -0.05 (-0.94%) At close: 04:10PM AEST Advertisement Start Trading >> Plus500 CFD Service. Your capital is at risk Summary Chart Statistics Historical data Profile Financials Analysis Options Holders Sustainability Previous close 5.31 24.444B 1D 5D 1M 6M YTD 1Y 5 Max Full screen 6.00 Open 5.36 Market cap Beta (5Y monthly) PE ratio (TTM) 1.03 5.26 Bid 23.59 4.33 5.26 x 6336400 5.28 x 19473500 Ask EPS (TTM) 0.22 2.67 Day's range 5.23-5.39 17 Feb 2022 1.00 52-week range 2.73 - 5.44 Earnings date Forward dividend & yield Ex-dividend date 0.17 (3.14%) Volume 15,478,203 10 Mar 2022 1 May 17 1 Nov 19 Avg. volume 21,207,235 1y target est 4.54 Balance sheet Currency in USD. All numbers in thousands Breakdown 29/06/2021 29/06/2020 29/06/2019 29/06/2018 Assets > Current assets 2,922,000 2,663,000 3,401,000 4,821,000 Non-current assets Property, plant and equip... 21,531,000 24,420,000 23,633,000 21,132,000 Gross property, plant and e... Accumulated depreciation -12,593,000 -14,740,000 - 14,037,000 -12,936,000 Net property, plant and e... 8,938,000 9,680,000 9,596,000 8,196,000 Goodwill 139,000 139.000 139,000 139.000 Intangible assets 50,000 109,000 94.000 82,000 Other long-term assets 85,000 88,000 80,000 92,000 Total non-current assets 10,320,000 11,074,000 11,314,000 10,312,000 Total assets 13,242,000 13,737,000 14,715,000 15,133,000 Liabilities and stockholders' eq... Liabilities > Current liabilities 1,462,000 1,271,000 1,688,000 1,664,000 > Non-current liabilities 2,826,000 2,904,000 2,859,000 2.760,000 Total liabilities 4,288,000 4,175,000 4,547,000 4,424,000 Stockholders' equity Common stock 13,597,000 13,943,000 14,212,000 14,493,000 -1,053,000 -765,000 -448,000 -367,000 Retained earnings Total stockholders' equity 8,955,000 9.563,000 10,169,000 10,710,000 Total liabilities and stockholde... 13,242,000 13,737,000 14,715,000 15,133,000 Income statement Currency in USD. All numbers in thousands TTM 29/06/2021 29/06/2020 29/06/2019 29/06/2018 Breakdown Total revenue 6,997,000 5,476,000 6,075,000 7,274,000 7,549,000 Cost of revenue 3,516,000 2,743,000 3,516,000 3,759,000 3,916,000 Gross profit 2,559,000 2,733,000 2,559,000 3,515,000 3,633,000 Operating expenses 2,516,000 2,014,000 2,516,000 2,791,000 2,541,000 Total operating expenses Operating income or loss 2,240,000 719,000 43,000 724.000 1,092,000 Interest expense 137.000 132.000 179,000 182,000 185,000 Income before tax 1,349,000 42.000 122.000 803,000 1,619,000 Income tax expense 335,000 -100,000 187,000 414.000 287,000 Income from continuing operations 1,014,000 142.000 -65,000 389,000 1,332,000 Net income 784,000 -195,000 -65,000 389,000 1,332,000 Net income available to common s... 784,000 -195,000 -65,000 389.000 1,332,000 Basic EPS -0.04 -0.01 0.08 0.26 Diluted EPS -0.04 -0.01 0.08 0.25 Basic average shares 4,771,000 4,892,000 5,051,948 5,162,791 Diluted average shares 4,771,000 4,892,000 5,118,421 5,244,094 EBITDA 894,000 1,040,000 1,742,000 2,546,000 Breakdown TTM 29/06/2021 29/06/2020 29/06/2019 29/06/2018 Cash flows from operating activ... Net income 784.000 -195,000 -65,000 389,000 1,332,000 Depreciation & amortisation 672.000 720,000 739,000 757,000 742,000 Stock-based compensation 25,000 32.000 29,000 38,000 40,000 Change in working capital -235,000 61,000 287,000 -129.000 -392,000 Inventory -199,000 -142,000 208,000 -58,000 -99,000 1,496,000 814.000 592,000 1,061,000 1,243,000 Other working capital Other non-cash items 37,000 198,000 146,000 85,000 57,000 2,059,000 1,405,000 1,365,000 1,817,000 1,717,000 Net cash provided by operatin... Cash flows from investing activi.... Investments in property, plant a... -563,000 -591,000 -773,000 -756,000 -474,000 Acquisitions, net -76,000 0 -76,000 -1,507,000 0 Purchases of investments -185,000 -152,000 -259,000 -411,000 -273,000 Sales/maturities of investments 188,000 140.000 206,000 305.000 407,000 Other investing activities -70,000 Net cash used for investing act... -557,000 -608,000 -873,000 -2,312,000 -301,000 Net change in cash 743,000 296,000 -70,000 -1,566,000 297.000 1,383,000 1,315,000 1,406,000 2.970,000 2,675,000 Cash at beginning of period Cash at end of period 2,126,000 1,613,000 1,315,000 1,406,000 2,970,000 Free cash flow Operating cash flow 2,059,000 1,405,000 1,365,000 1,817,000 1,717,000 Capital expenditure -563,000 -591,000 -773,000 -756.000 -474,000 Free cash flow 1,496,000 814.000 592.000 1,061,000 1,243,000 Date Dividends 10 Mar 2022 0.119486 Dividend 09 Sept 2021 0.027141 Dividend 11 Mar 2021 0.018088 Dividend 10 Sept 2020 0.013689 Dividend 05 Mar 2020 0.016737 Dividend 12 Sept 2019 0.041051 Dividend 07 Mar 2019 0.02397 Dividend 13 Sept 2018 0.086581 Dividend 08 Mar 2018 0.038412 Dividend 14 Sept 2017 0.079843 Dividend *Close price adjusted for splits. **Close price adjusted for splits and dividend and/or capital gain distributions. Dividends & splits Forward annual dividend rate 4 Forward annual dividend yield 4 0.17 3.14% Trailing annual dividend rate 3 0.12 Trailing annual dividend yield 3 2.30% 5-year average dividend yield 4 3.03 Payout ratio 4 22.05% Dividend date 3 3 N/A 4 Ex-dividend date 09 Mar 2022 Last split factor 2 N/A Last split date N/A Add to watchlist South32 Limited (532.AX) ASX - ASX Delayed price. Currency in AUD 5.26 -0.05 (-0.94%) At close: 04:10PM AEST Advertisement Start Trading >> Plus500 CFD Service. Your capital is at risk Summary Chart Statistics Historical data Profile Financials Analysis Options Holders Sustainability Previous close 5.31 24.444B 1D 5D 1M 6M YTD 1Y 5 Max Full screen 6.00 Open 5.36 Market cap Beta (5Y monthly) PE ratio (TTM) 1.03 5.26 Bid 23.59 4.33 5.26 x 6336400 5.28 x 19473500 Ask EPS (TTM) 0.22 2.67 Day's range 5.23-5.39 17 Feb 2022 1.00 52-week range 2.73 - 5.44 Earnings date Forward dividend & yield Ex-dividend date 0.17 (3.14%) Volume 15,478,203 10 Mar 2022 1 May 17 1 Nov 19 Avg. volume 21,207,235 1y target est 4.54 Balance sheet Currency in USD. All numbers in thousands Breakdown 29/06/2021 29/06/2020 29/06/2019 29/06/2018 Assets > Current assets 2,922,000 2,663,000 3,401,000 4,821,000 Non-current assets Property, plant and equip... 21,531,000 24,420,000 23,633,000 21,132,000 Gross property, plant and e... Accumulated depreciation -12,593,000 -14,740,000 - 14,037,000 -12,936,000 Net property, plant and e... 8,938,000 9,680,000 9,596,000 8,196,000 Goodwill 139,000 139.000 139,000 139.000 Intangible assets 50,000 109,000 94.000 82,000 Other long-term assets 85,000 88,000 80,000 92,000 Total non-current assets 10,320,000 11,074,000 11,314,000 10,312,000 Total assets 13,242,000 13,737,000 14,715,000 15,133,000 Liabilities and stockholders' eq... Liabilities > Current liabilities 1,462,000 1,271,000 1,688,000 1,664,000 > Non-current liabilities 2,826,000 2,904,000 2,859,000 2.760,000 Total liabilities 4,288,000 4,175,000 4,547,000 4,424,000 Stockholders' equity Common stock 13,597,000 13,943,000 14,212,000 14,493,000 -1,053,000 -765,000 -448,000 -367,000 Retained earnings Total stockholders' equity 8,955,000 9.563,000 10,169,000 10,710,000 Total liabilities and stockholde... 13,242,000 13,737,000 14,715,000 15,133,000 Income statement Currency in USD. All numbers in thousands TTM 29/06/2021 29/06/2020 29/06/2019 29/06/2018 Breakdown Total revenue 6,997,000 5,476,000 6,075,000 7,274,000 7,549,000 Cost of revenue 3,516,000 2,743,000 3,516,000 3,759,000 3,916,000 Gross profit 2,559,000 2,733,000 2,559,000 3,515,000 3,633,000 Operating expenses 2,516,000 2,014,000 2,516,000 2,791,000 2,541,000 Total operating expenses Operating income or loss 2,240,000 719,000 43,000 724.000 1,092,000 Interest expense 137.000 132.000 179,000 182,000 185,000 Income before tax 1,349,000 42.000 122.000 803,000 1,619,000 Income tax expense 335,000 -100,000 187,000 414.000 287,000 Income from continuing operations 1,014,000 142.000 -65,000 389,000 1,332,000 Net income 784,000 -195,000 -65,000 389,000 1,332,000 Net income available to common s... 784,000 -195,000 -65,000 389.000 1,332,000 Basic EPS -0.04 -0.01 0.08 0.26 Diluted EPS -0.04 -0.01 0.08 0.25 Basic average shares 4,771,000 4,892,000 5,051,948 5,162,791 Diluted average shares 4,771,000 4,892,000 5,118,421 5,244,094 EBITDA 894,000 1,040,000 1,742,000 2,546,000 Breakdown TTM 29/06/2021 29/06/2020 29/06/2019 29/06/2018 Cash flows from operating activ... Net income 784.000 -195,000 -65,000 389,000 1,332,000 Depreciation & amortisation 672.000 720,000 739,000 757,000 742,000 Stock-based compensation 25,000 32.000 29,000 38,000 40,000 Change in working capital -235,000 61,000 287,000 -129.000 -392,000 Inventory -199,000 -142,000 208,000 -58,000 -99,000 1,496,000 814.000 592,000 1,061,000 1,243,000 Other working capital Other non-cash items 37,000 198,000 146,000 85,000 57,000 2,059,000 1,405,000 1,365,000 1,817,000 1,717,000 Net cash provided by operatin... Cash flows from investing activi.... Investments in property, plant a... -563,000 -591,000 -773,000 -756,000 -474,000 Acquisitions, net -76,000 0 -76,000 -1,507,000 0 Purchases of investments -185,000 -152,000 -259,000 -411,000 -273,000 Sales/maturities of investments 188,000 140.000 206,000 305.000 407,000 Other investing activities -70,000 Net cash used for investing act... -557,000 -608,000 -873,000 -2,312,000 -301,000 Net change in cash 743,000 296,000 -70,000 -1,566,000 297.000 1,383,000 1,315,000 1,406,000 2.970,000 2,675,000 Cash at beginning of period Cash at end of period 2,126,000 1,613,000 1,315,000 1,406,000 2,970,000 Free cash flow Operating cash flow 2,059,000 1,405,000 1,365,000 1,817,000 1,717,000 Capital expenditure -563,000 -591,000 -773,000 -756.000 -474,000 Free cash flow 1,496,000 814.000 592.000 1,061,000 1,243,000 Date Dividends 10 Mar 2022 0.119486 Dividend 09 Sept 2021 0.027141 Dividend 11 Mar 2021 0.018088 Dividend 10 Sept 2020 0.013689 Dividend 05 Mar 2020 0.016737 Dividend 12 Sept 2019 0.041051 Dividend 07 Mar 2019 0.02397 Dividend 13 Sept 2018 0.086581 Dividend 08 Mar 2018 0.038412 Dividend 14 Sept 2017 0.079843 Dividend *Close price adjusted for splits. **Close price adjusted for splits and dividend and/or capital gain distributions. Dividends & splits Forward annual dividend rate 4 Forward annual dividend yield 4 0.17 3.14% Trailing annual dividend rate 3 0.12 Trailing annual dividend yield 3 2.30% 5-year average dividend yield 4 3.03 Payout ratio 4 22.05% Dividend date 3 3 N/A 4 Ex-dividend date 09 Mar 2022 Last split factor 2 N/A Last split date N/A
Step by Step Solution
There are 3 Steps involved in it

Get step-by-step solutions from verified subject matter experts