

Question: Using the information given, you are to determine whether this information suggests that Tesla should have relatively (% of assets or % of capital) more
Using the information given, you are to determine whether this information suggests that Tesla should have relatively (% of assets or % of capital) more or less debt in its financing mix than is the case for the average firm in the industry. Point to specifics that provide support for your recommendation. Provide an overall recommendation (TSLA should use relatively less/more debt). Point to at least 3 (or 4) specific factors that support your conclusion (and describe how). USE ONLY THE INFO IN THIS CASE.
Industry Life Cycle & Company Growth
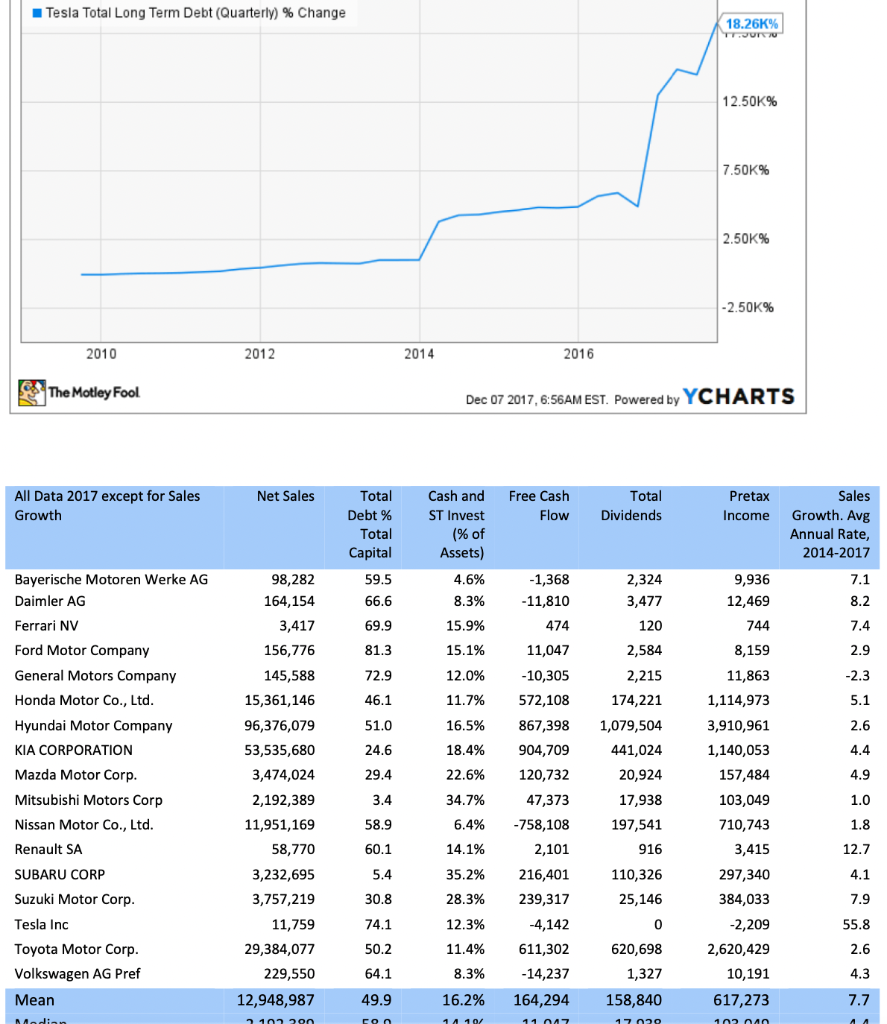
While the auto industry was very much in the mature stage of the life cycle in 2017, Tesla was closer in character to that of a growth company. Tesla had rapid sales growth from 2014 through 2017, with average sales growth of 55% per year. This growth was somewhat hampered by manufacturing capacity and inefficient production processes. To alleviate this problem, Tesla was in the middle of an even more rapid capital investment phase, building new production plants in China and Europe, and expanding production capacity at its existing plant.
Industry Dynamics and Competitive Positioning
By the nature of its product, an expensive, discretionary item, the auto industry is highly cyclical. Historically, auto sales and profitability move with the business cycle, with auto firms typically doing well during economic expansions and poorly during recessions. The industry is characterized by high fixed operating costs, and relatively high use of debt by many firms in the industry. While competition is high in the auto industry, all participants try to differentiate their product from that of the competition in order to increase sales and profit margins. This is a characteristic of the industry structure commonly referred to as monopolistic competition (not monopoly). Teslas product is further differentiated from its competition. Unlike its competition, Tesla was in the process of building an entire ecosystem of charging stations, a repair network bringing the mechanic to the owner, and a home delivery system. If EVs were to take hold in a nation built around the combustion engine, then this would give Tesla an initial advantage against competition. In fact, industry analysts and auto engineers estimated at the time that Tesla had a ten year head start on the competition.
Information/Signaling
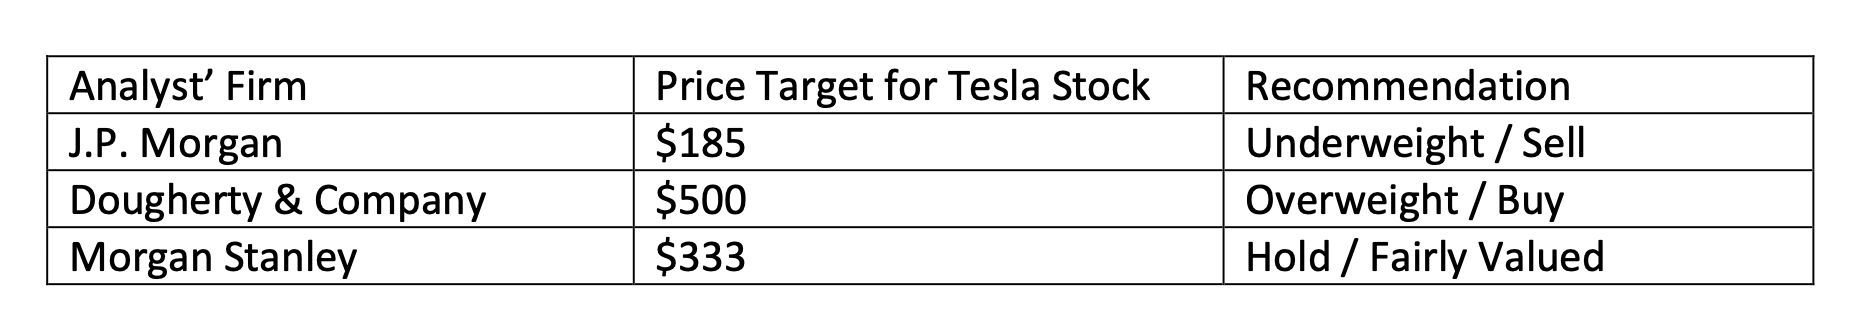
By virtue of their stage in the industry life cycle, and the nature of their product, the value of most automotive manufacturers is a function of assets in place, whereas Teslas value was much more a function of its growth opportunities. This makes Teslas value harder to determine than other firms in the industry, and places a greater importance on insider information. To underpin the problem with placing an intrinsic value on Tesla at this time, consider the following price targets: Analyst Firm J.P. Morgan Dougherty & Company Morgan Stanley Income Taxes Price Target
Income Taxes
Until 2017, the top federal corporate income tax rate had been stable at 35%. With president Donald Trumps entry into the White House that same year, the top rate was reduced to 21%. All corporations in the U.S. were subject to the same income tax rates, though their operating profitability would largely determine the size of their tax bill.
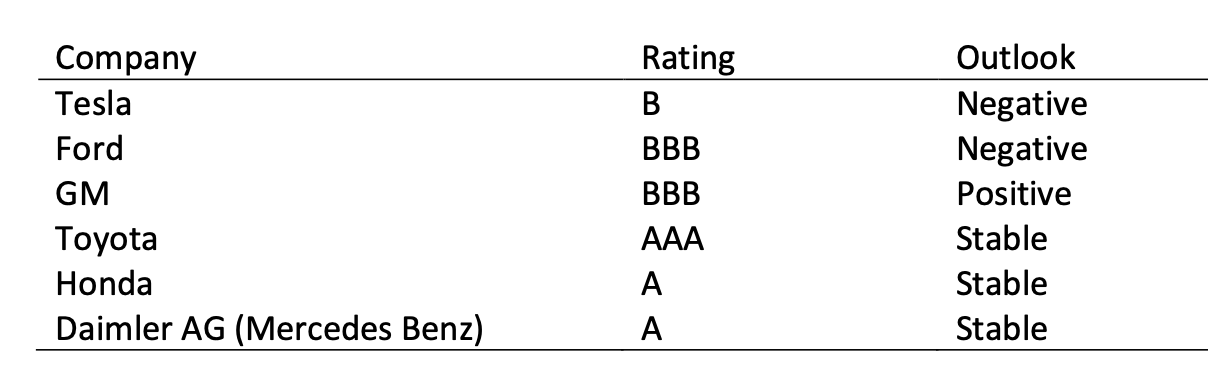
Credit Rating & Bankruptcy Risk
Credit ratings reflect the likelihood of bankruptcy. These ratings range from best to worst as follows: AAA, AA, A, BBB, BB, B, CCC, CC, C, D (D = in default). With lower ratings comes higher interest rates on debt, reflecting lenders reluctance to lend to those deemed to pose a greater threat of non- payment. Below are the credit ratings for Tesla and several of its competitors in 2017:
\begin{tabular}{|l|l|l|} \hline Analyst' Firm & Price Target for Tesla Stock & Recommendation \\ \hline J.P. Morgan & $185 & Underweight / Sell \\ \hline Dougherty \& Company & $500 & Overweight / Buy \\ \hline Morgan Stanley & $333 & Hold / Fairly Valued \\ \hline \end{tabular} \begin{tabular}{lll} Company & Rating & Outlook \\ \hline Tesla & B & Negative \\ Ford & BBB & Negative \\ GM & BBB & Positive \\ Toyota & AAA & Stable \\ Honda & A & Stable \\ Daimler AG (Mercedes Benz) & A & Stable \\ \hline \end{tabular} Financial Information Profitability (\%) OperatingMarginNetMarginReturnonAssetsReturnonEquityReturnonInvestedCapital13.916.77.643.614.39.99.64.423.18.719.222.012.788.829.06.99.27.137.214.63.03.74.218.78.295.495.943.4227.276.8123.1124.646.3118.065.7 Liquidity Current Ratio 0.91.11.01.51.91.01.9 Coverage TimesInterestEarnedTimesBurdenCovered2.72.72.82.84.84.81.91.92.42.450.250.248.948.9 Leverage TotalDebt/TotalAssets(%)42.337.936.142.425.141.939.3 Tesla Total Long Term Debt (Quarterly) \% Change 18.26K% \begin{tabular}{|l|l|l|} \hline Analyst' Firm & Price Target for Tesla Stock & Recommendation \\ \hline J.P. Morgan & $185 & Underweight / Sell \\ \hline Dougherty \& Company & $500 & Overweight / Buy \\ \hline Morgan Stanley & $333 & Hold / Fairly Valued \\ \hline \end{tabular} \begin{tabular}{lll} Company & Rating & Outlook \\ \hline Tesla & B & Negative \\ Ford & BBB & Negative \\ GM & BBB & Positive \\ Toyota & AAA & Stable \\ Honda & A & Stable \\ Daimler AG (Mercedes Benz) & A & Stable \\ \hline \end{tabular} Financial Information Profitability (\%) OperatingMarginNetMarginReturnonAssetsReturnonEquityReturnonInvestedCapital13.916.77.643.614.39.99.64.423.18.719.222.012.788.829.06.99.27.137.214.63.03.74.218.78.295.495.943.4227.276.8123.1124.646.3118.065.7 Liquidity Current Ratio 0.91.11.01.51.91.01.9 Coverage TimesInterestEarnedTimesBurdenCovered2.72.72.82.84.84.81.91.92.42.450.250.248.948.9 Leverage TotalDebt/TotalAssets(%)42.337.936.142.425.141.939.3 Tesla Total Long Term Debt (Quarterly) \% Change 18.26K%
Step by Step Solution
There are 3 Steps involved in it

Get step-by-step solutions from verified subject matter experts