

Question: Using the information in the Exam 2 Financial Statement Analysis Excel, what are the answers for E1, E2, and E3? 0.2637;0.1915;0.79450.2618;0.7945;0.12170.2637;0.7945;0.35380.1915;0.7945;0.1217 Question 6 Using the
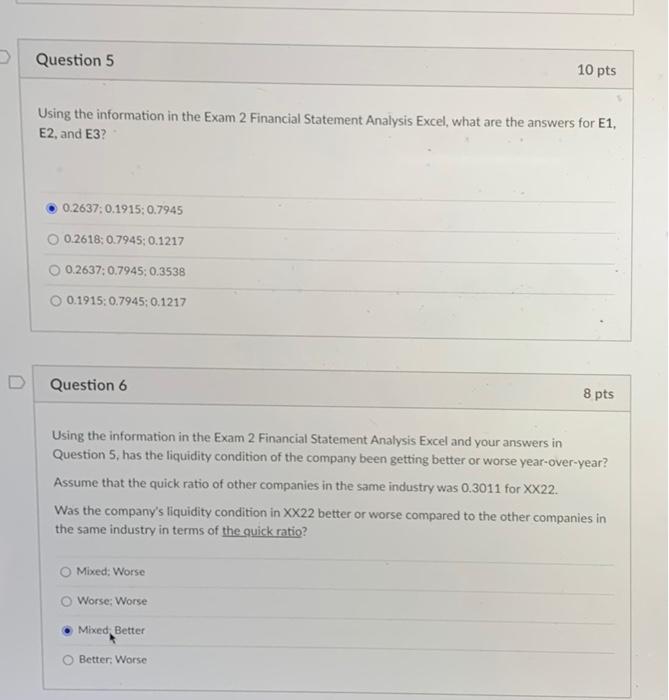
Using the information in the Exam 2 Financial Statement Analysis Excel, what are the answers for E1, E2, and E3? 0.2637;0.1915;0.79450.2618;0.7945;0.12170.2637;0.7945;0.35380.1915;0.7945;0.1217 Question 6 Using the information in the Exam 2 Financial Statement Analysis Excel and your answers in Question 5 , has the liquidity condition of the company been getting better or worse year-over-year? Assume that the quick ratio of other companies in the same industry was 0.3011 for X22. Was the company's liquidity condition in XX22 better or worse compared to the other companies in the same industry in terms of the quick ratio? Mixed: Worse Worse; Worse Mixed Better Better: Worse
Step by Step Solution
There are 3 Steps involved in it

Get step-by-step solutions from verified subject matter experts