

Question: Using the information in the graphs can someone help me calculate the actual calculations for the company. I am having trouble understanding the information and
Using the information in the graphs can someone help me calculate the actual calculations for the company. I am having trouble understanding the information and don't want to make any simple mistakes. This is all the information I was given to solve the table, thank you for your time and help!
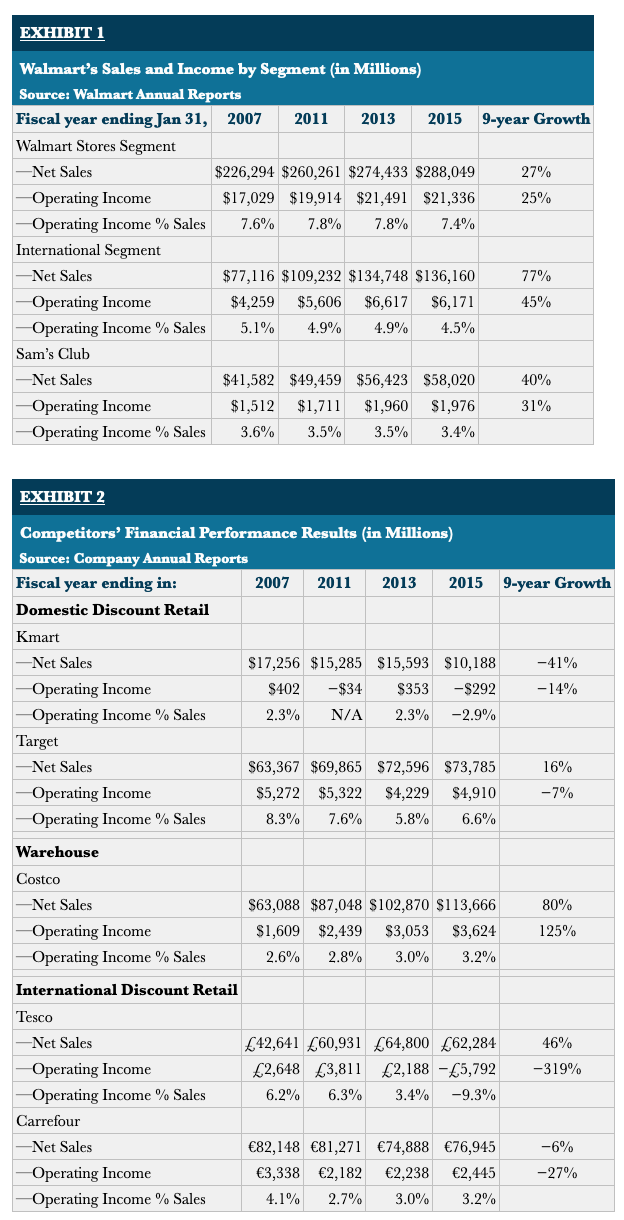
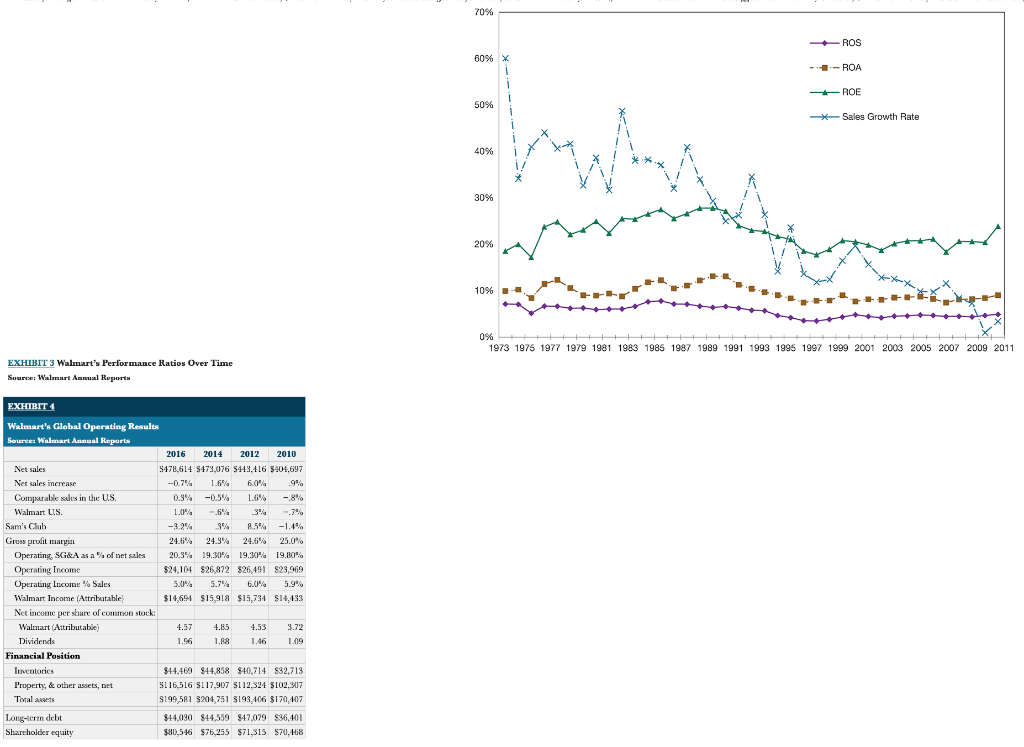
EXHIIBIT 1 Walmart's Sales and Income by Segment (in Millions) Source: Walmart Annual Reports EXHIIBIT 2 Competitors' Financial Performance Results (in Millions) Source: Company Annual Reports EXHIBIT 3 Walmart's Performance Ratios Over Time Source: Walansurt Annusal Reponts EXHIIBIT 1 Walmart's Sales and Income by Segment (in Millions) Source: Walmart Annual Reports EXHIIBIT 2 Competitors' Financial Performance Results (in Millions) Source: Company Annual Reports EXHIBIT 3 Walmart's Performance Ratios Over Time Source: Walansurt Annusal Reponts
Step by Step Solution
There are 3 Steps involved in it

Get step-by-step solutions from verified subject matter experts