

Question: Using the information in the table below and assuming a constant price of $35 per unit, graph the MC, AC, and MR curves. Put all
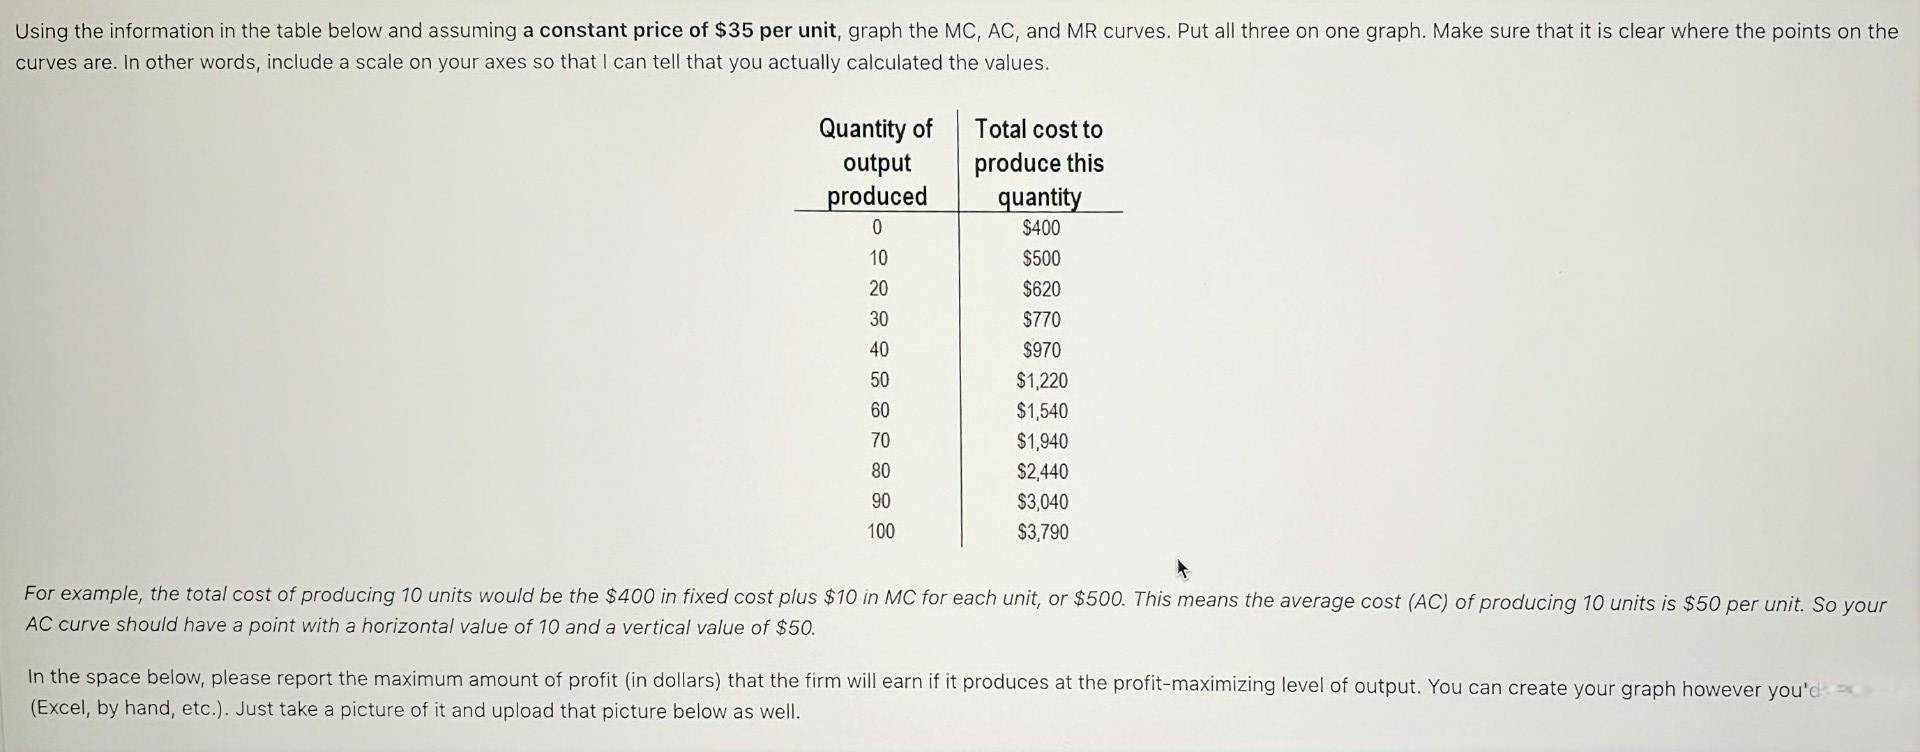
Using the information in the table below and assuming a constant price of $35 per unit, graph the MC, AC, and MR curves. Put all three on one graph. Make sure that it is clear where the points on the curves are. In other words, include a scale on your axes so that I can tell that you actually calculated the values. Quantity of Total cost to output produce this produced quantity 0 $400 10 $500 20 $620 30 $770 40 $970 50 $1,220 60 $1,540 70 $1,940 80 $2,440 90 $3,040 100 $3,790 For example, the total cost of producing 10 units would be the $400 in fixed cost plus $10 in MC for each unit, or $500. This means the average cost (AC) of producing 10 units is $50 per unit. So your AC curve should have a point with a horizontal value of 10 and a vertical value of $50. In the space below, please report the maximum amount of profit (in dollars) that the firm will earn if it produces at the profit-maximizing level of output. You can create your graph however you'd (Excel, by hand, etc.). Just take a picture of it and upload that picture below as well
Step by Step Solution
There are 3 Steps involved in it

Get step-by-step solutions from verified subject matter experts