

Question: Using the information in the table below and assuming a constant price of $35 per unit , graph the MC, AC, and MR curves. Put
Using the information in the table below and assuminga constant price of $35 per unit, graph the MC, AC, and MR curves. Put all three on one graph. Make sure that it is clear where the points on the curves are. In other words, include a scale on your axes so that I can tell that you actually calculated the values.
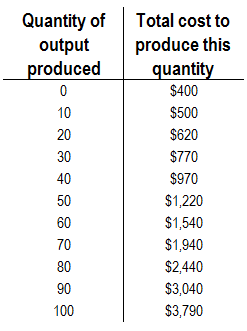
Quantity of Total cost to output produce this produced quantity $400 10 $500 20 $620 30 $770 40 $970 50 $1,220 60 $1,540 70 $1,940 80 $2,440 90 $3,040 100 $3,790
Step by Step Solution
There are 3 Steps involved in it
1 Expert Approved Answer
Step: 1 Unlock

Question Has Been Solved by an Expert!
Get step-by-step solutions from verified subject matter experts
Step: 2 Unlock
Step: 3 Unlock