

Question: Using the information provided I want the required 3, 4, 5, and 6 completed, please. Required information [The following information applies to the questions displayed
Using the information provided I want the required 3, 4, 5, and 6 completed, please.
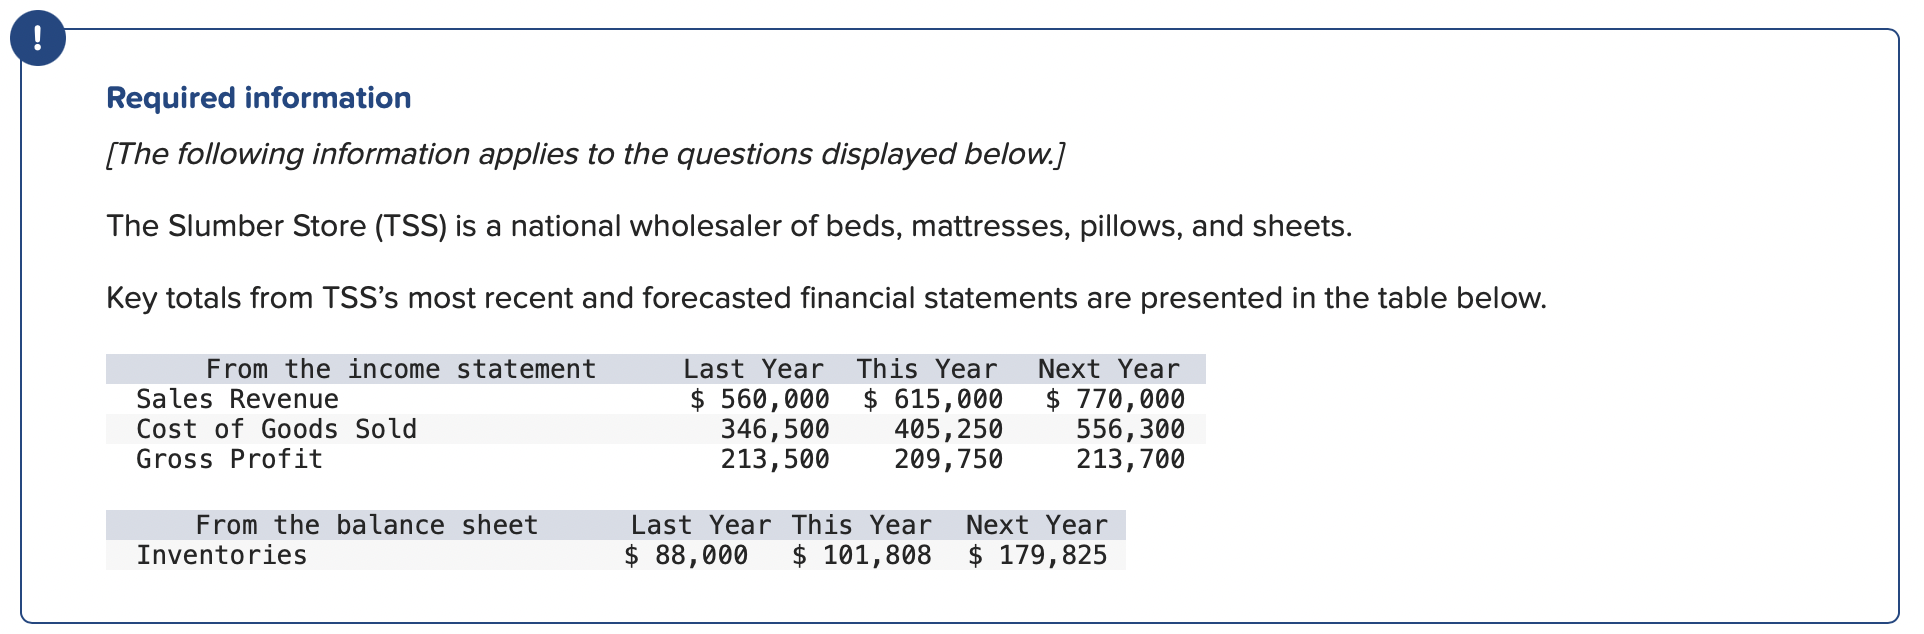
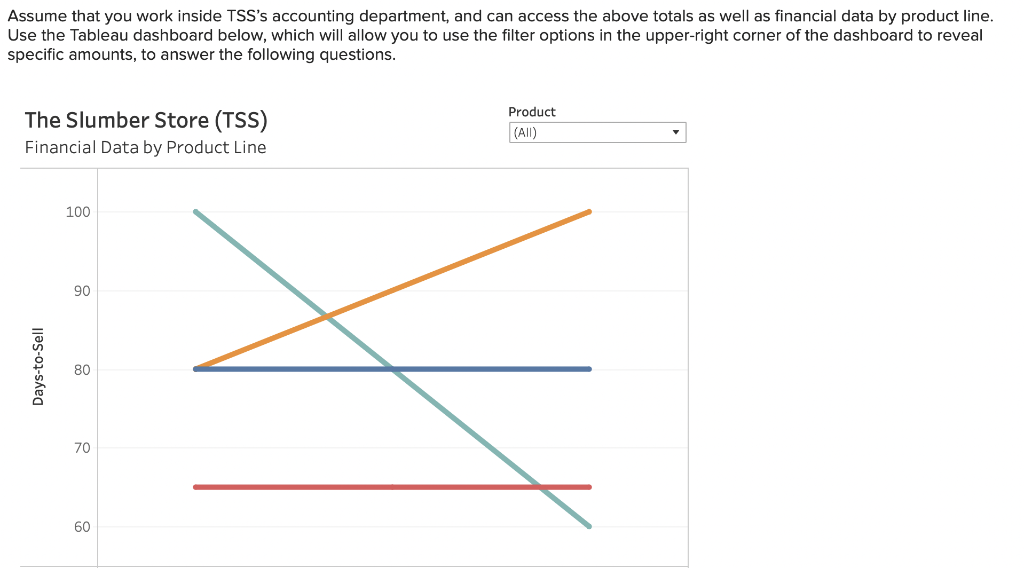
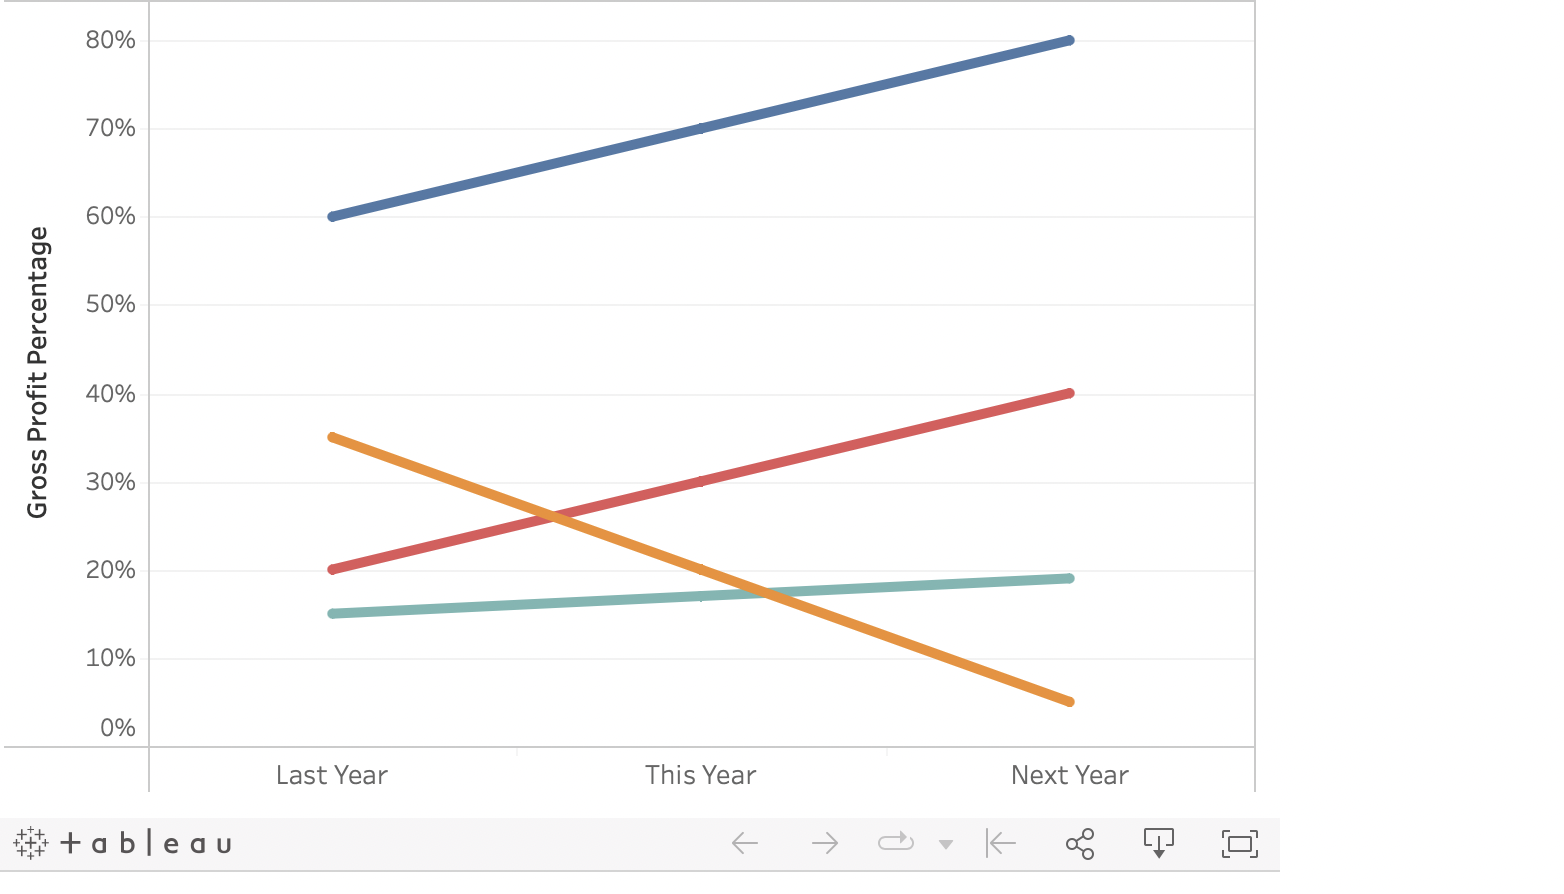
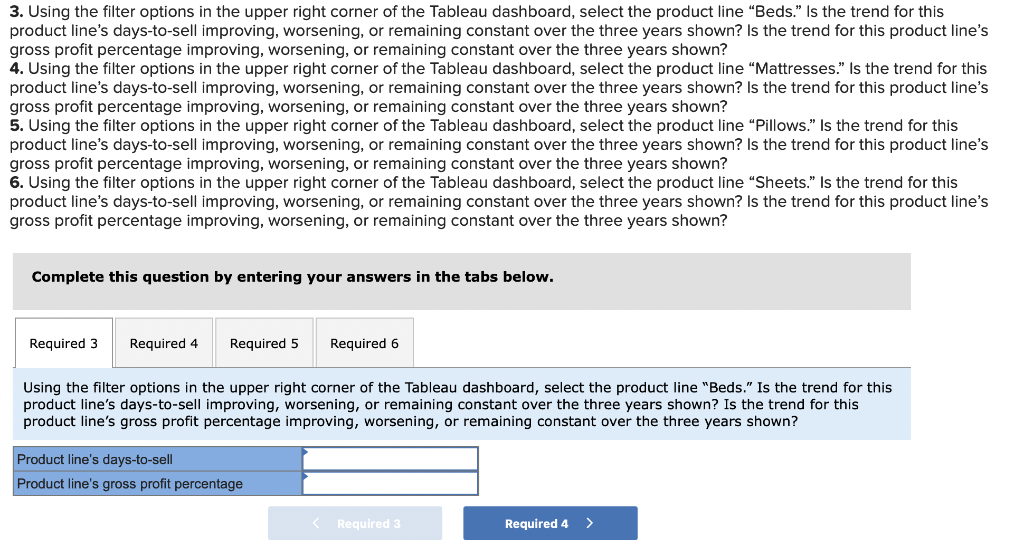
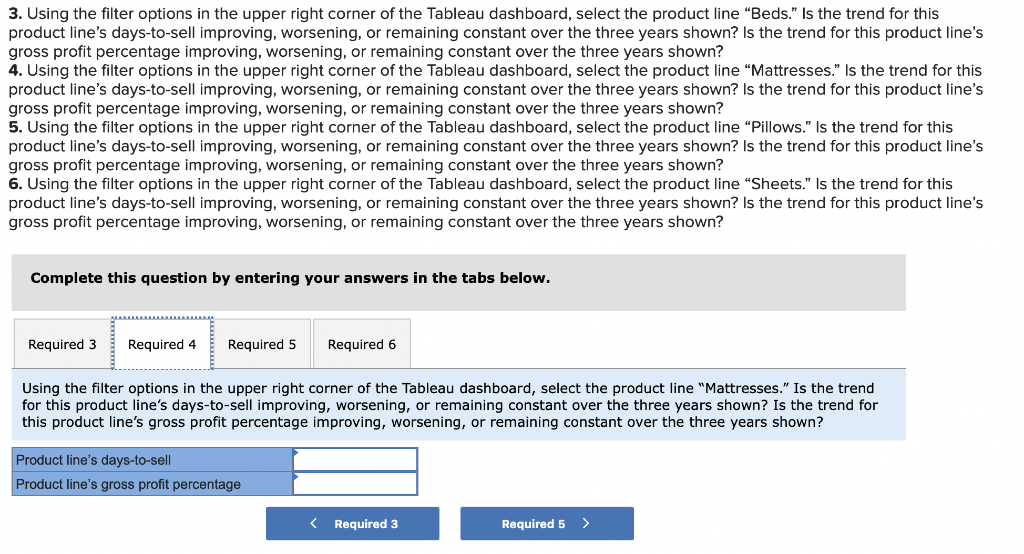
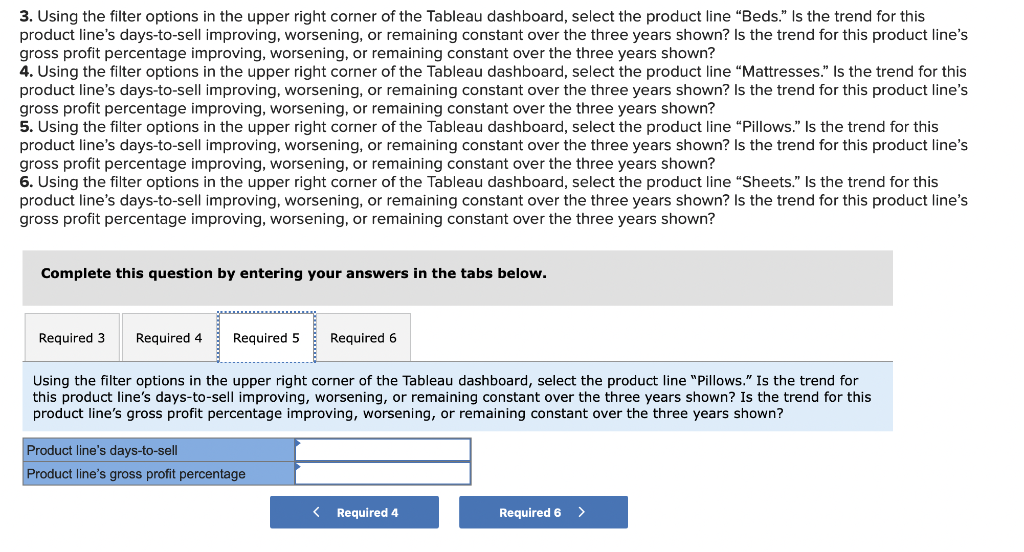
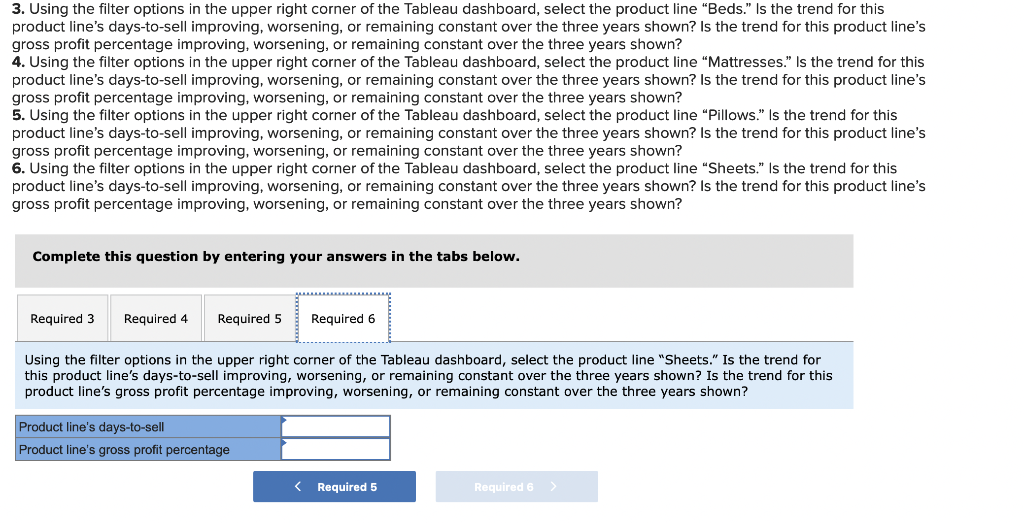
Required information [The following information applies to the questions displayed below.) The Slumber Store (TSS) is a national wholesaler of beds, mattresses, pillows, and sheets. Key totals from TSS's most recent and forecasted financial statements are presented in the table below. From the income statement Sales Revenue Cost of Goods Sold Gross Profit Last Year $ 560,000 346,500 213,500 This Year $ 615,000 405,250 209,750 Next Year $ 770,000 556,300 213,700 From the balance sheet Inventories Last Year This Year Next Year $ 88,000 $ 101,808 $ 179,825 Assume that you work inside TSS's accounting department, and can access the above totals as well as financial data by product line. Use the Tableau dashboard below, which will allow you to use the filter options in the upper-right corner of the dashboard to reveal specific amounts, to answer the following questions. The Slumber Store (TSS) Financial Data by Product Line Product (All) 100 90 Days-to-Sell 80 70 60 80% 70% 60% 50% Gross Profit Percentage 40% 30% 20% 10% 0% Last Year This Year Next Year tableau E K 3. Using the filter options in the upper right corner of the Tableau dashboard, select the product line "Beds." Is the trend for this product line's days-to-sell improving, worsening, or remaining constant over the three years shown? Is the trend for this product line's gross profit percentage improving, worsening, or remaining constant over the three years shown? 4. Using the filter options in the upper right corner of the Tableau dashboard, select the product line "Mattresses." Is the trend for this product line's days-to-sell improving, worsening, or remaining constant over the three years shown? Is the trend for this product line's gross profit percentage improving, worsening, or remaining constant over the three years shown? 5. Using the filter options in the upper right corner of the Tableau dashboard, select the product line "Pillows." Is the trend for this product line's days-to-sell improving, worsening, or remaining constant over the three years shown? Is the trend for this product line's gross profit percentage improving, worsening, or remaining constant over the three years shown? 6. Using the filter options in the upper right corner of the Tableau dashboard, select the product line "Sheets." Is the trend for this product line's days-to-sell improving, worsening, or remaining constant over the three years shown? Is the trend for this product line's gross profit percentage improving, worsening, or remaining constant over the three years shown? Complete this question by entering your answers in the tabs below. Required 3 Required 4 Required 5 Required 6 Using the filter options in the upper right corner of the Tableau dashboard, select the product line "Beds." Is the trend for this product line's days-to-sell improving, worsening, or remaining constant over the three years shown? Is the trend for this product line's gross profit percentage improving, worsening, or remaining constant over the three years shown? Product line's days-to-sell Product line's gross profit percentage (Required 3 Required 4 3. Using the filter options in the upper right corner of the Tableau dashboard, select the product line "Beds." Is the trend for this product line's days-to-sell improving, worsening, or remaining constant over the three years shown? Is the trend for this product line's gross profit percentage improving, worsening, or remaining constant over the three years shown? 4. Using the filter options in the upper right corner of the Tableau dashboard, select the product line "Mattresses." Is the trend for this product line's days-to-sell improving, worsening, or remaining constant over the three years shown? Is the trend for this product line's gross profit percentage improving, worsening, or remaining constant over the three years shown? 5. Using the filter options in the upper right corner of the Tableau dashboard, select the product line "Pillows." Is the trend for this product line's days-to-sell improving, worsening, or remaining constant over the three years shown? Is the trend for this product line's gross profit percentage improving, worsening, or remaining constant over the three years shown? 6. Using the filter options in the upper right corner of the Tableau dashboard, select the product line Sheets. Is the trend for this product line's days-to-sell improving, worsening, or remaining constant over the three years shown? Is the trend for this product line's gross profit percentage improving, worsening, or remaining constant over the three years shown? Complete this question by entering your answers in the tabs below. Required 3 Required 4 Required 5 Required 6 Using the filter options in the upper right corner of the Tableau dashboard, select the product line "Mattresses." Is the trend for this product line's days-to-sell improving, worsening, or remaining constant over the three years shown? Is the trend for this product line's gross profit percentage improving, worsening, or remaining constant over the three years shown? Product line's days-to-sell Product line's gross profit percentage 3. Using the filter options in the upper right corner of the Tableau dashboard, select the product line "Beds." is the trend for this product line's days-to-sell improving, worsening, or remaining constant over the three years shown? Is the trend for this product line's gross profit percentage improving, worsening, or remaining constant over the three years shown? 4. Using the filter options in the upper right corner of the Tableau dashboard, select the product line Mattresses. Is the trend for this product line's days-to-sell improving, worsening, or remaining constant over the three years shown? Is the trend for this product line's gross profit percentage improving, worsening, or remaining constant over the three years shown? 5. Using the filter options in the upper right corner of the Tableau dashboard, select the product line "Pillows." Is the trend for this product line's days-to-sell improving, worsening, or remaining constant over the three years shown? Is the trend for this product line's gross profit percentage improving, worsening, or remaining constant over the three years shown? 6. Using the filter options in the upper right corner of the Tableau dashboard, select the product line "Sheets." Is the trend for this product line's days-to-sell improving, worsening, or remaining constant over the three years shown? Is the trend for this product line's gross profit percentage improving, worsening, or remaining constant over the three years shown? Complete this question by entering your answers in the tabs below. Required 3 Required 4 Required 5 Required 6 Using the filter options in the upper right corner of the Tableau dashboard, select the product line "Pillows." Is the trend for this product line's days-to-sell improving, worsening, or remaining constant over the three years shown? Is the trend for this product line's gross profit percentage improving, worsening, or remaining constant over the three years shown? Product line's days-to-sell Product line's gross profit percentage
Step by Step Solution
There are 3 Steps involved in it

Get step-by-step solutions from verified subject matter experts