

Question: Using the iris dataset and the following template ggplot (data )+ GEOM-FUNCTION> (mapping FACET FUNCTION> aes ( )) write code that will produce the graphic
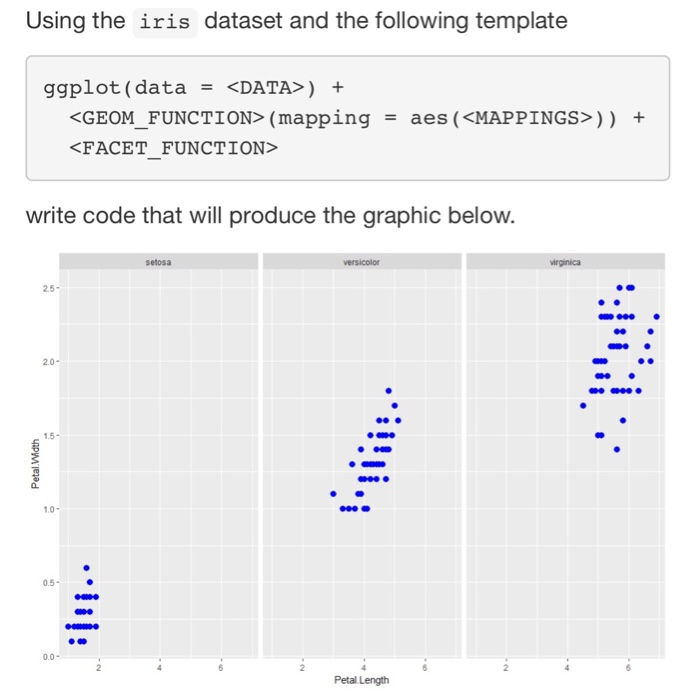
Using the iris dataset and the following template ggplot (data)+ GEOM-FUNCTION> (mapping FACET FUNCTION> aes (
Step by Step Solution
There are 3 Steps involved in it
1 Expert Approved Answer
Step: 1 Unlock

Question Has Been Solved by an Expert!
Get step-by-step solutions from verified subject matter experts
Step: 2 Unlock
Step: 3 Unlock