

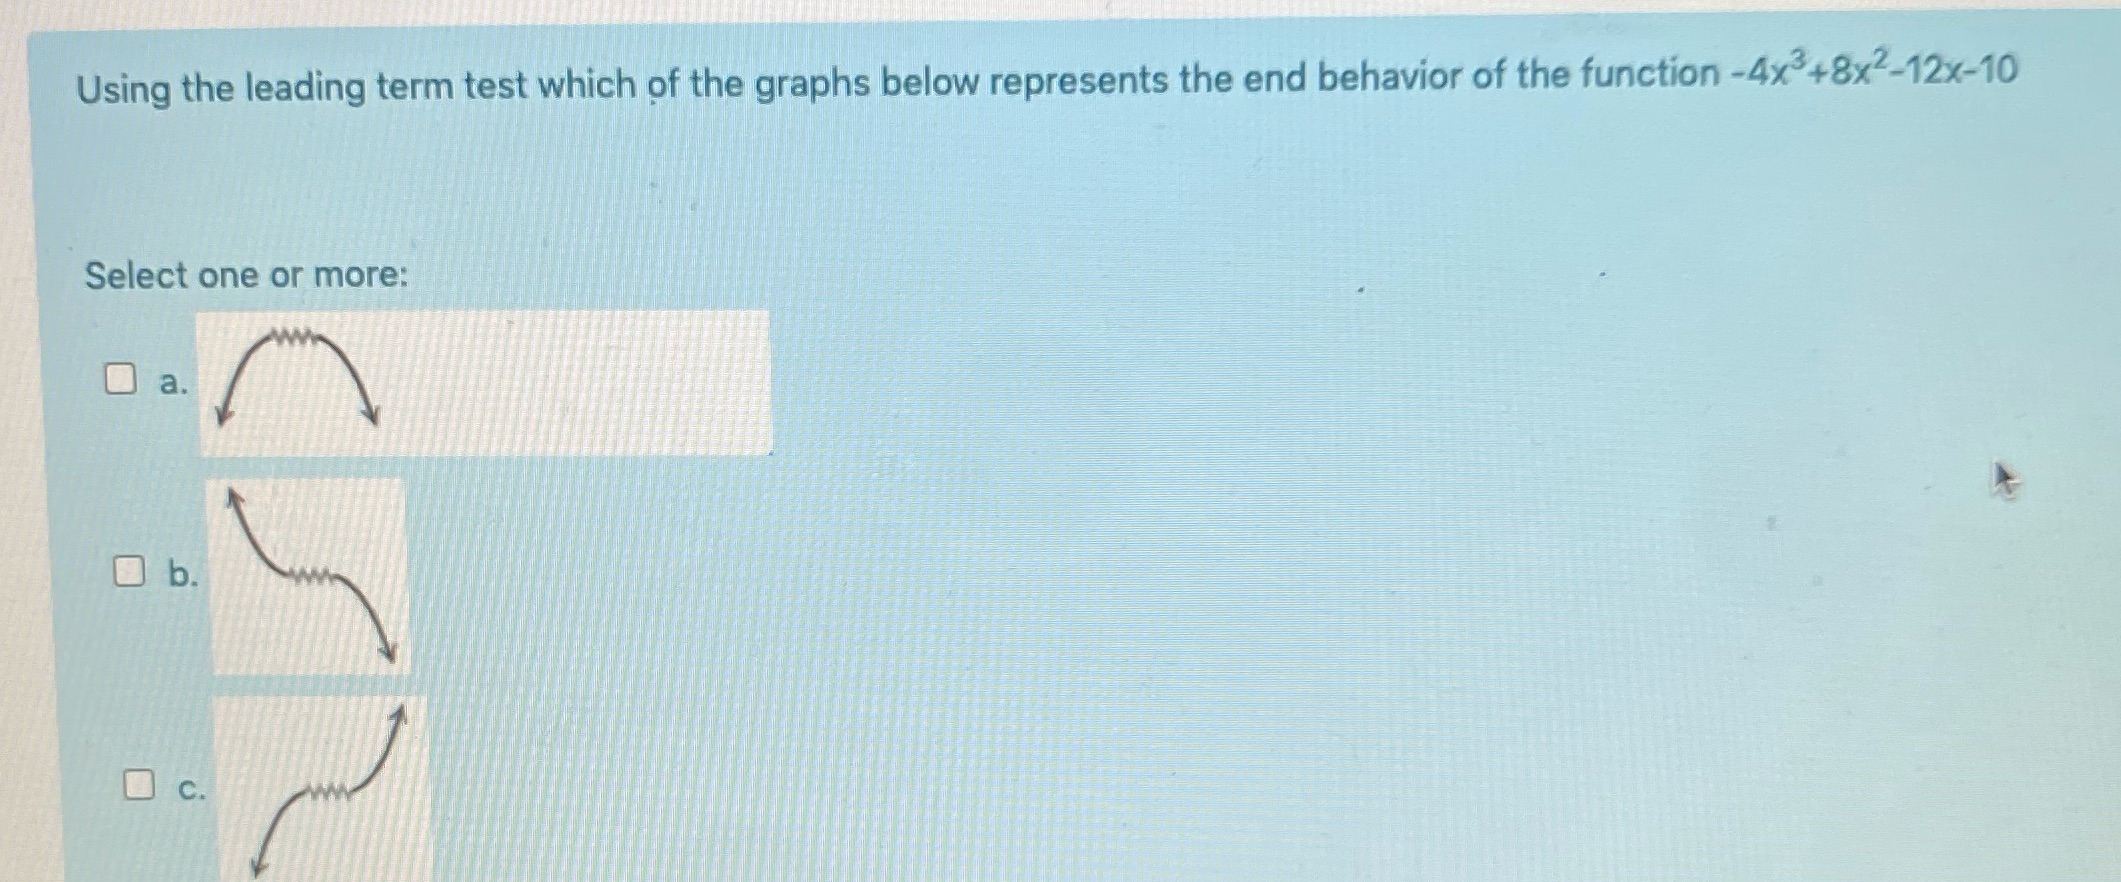
Question: Using the leading term test which of the graphs below represents the end behavior of the function -4x3+8x2-12x-10 Select one or more: O a. O
Step by Step Solution
There are 3 Steps involved in it
1 Expert Approved Answer
Step: 1 Unlock

Question Has Been Solved by an Expert!
Get step-by-step solutions from verified subject matter experts
Step: 2 Unlock
Step: 3 Unlock