

3. Suppose the graph below represents domestic supply of Good Z in autarky and domestic demand for...
Question:
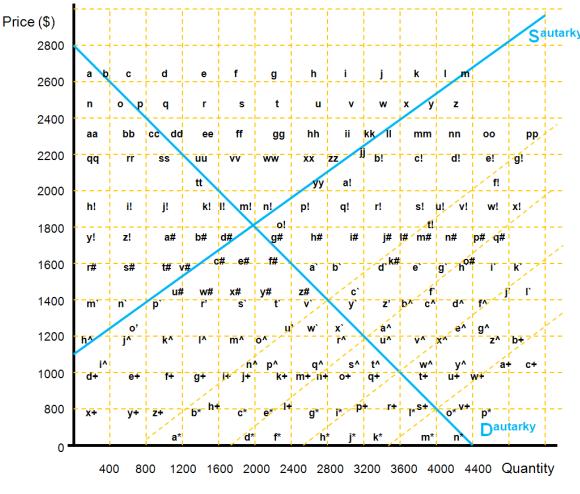
3. Suppose the graph below represents domestic supply of Good Z in autarky and domestic demand for Good Z for Country Lambda. Assume that Country Lambda is a small nation relative to the rest of the world.
a. State the numerical values for the following items. (Use approximate whole numbers based on the graph.) (1 point each; 2 points total) Peautarky = ____. Qeautarky = ____. b. Using the letters in the graph, state what areas comprise consumer surplus in autarky. (2 points) |
c. Using the letters in the graph, state what areas comprise producer surplus in autarky. (2 points)
Now, suppose the country can purchase as many units as it wants at the world market price of $1200. (Assume for the moment that Lambda has not imposed any trade restrictions.)
d. In the graph above, draw and label the supply curve for Good Z available to Lambda through domestic and world production. (2 points)
e. State the numerical values for the following items. (Use approximate whole numbers based on the graph.) (1 point each; 4 points total)
Qconsumed domesticallyfree trade= ________. Pworld = ________.
Qproduced domesticallyfree trade= ________. # imports under free trade = _________.
f. In the graph above, shade in the area that represents consumer surplus under free trade conditions. (2 points)
g. Using the letters from the graph, state what areas comprise producer surplus under free trade conditions. (2 points)
Now, suppose the domestic manufacturers of Good Z successfully lobby for trade restrictions resulting in a $400 specific tariff being placed on imports of Good Z.
h. In the graph above, draw and label the supply curve for Good Z available to Lambda through domestic and world production after this tariff is imposed. (2 points)
i. State the numerical values for the following items. (Use approximate whole numbers based on the graph.) (1 point each; 4 points total)
Qconsumed domesticallytariff= ________. Pworld + tariff = ________.
Qproduced domesticallytariff = ________. # imports under tariff = _________.
j. Using the letters in the graph and/or clearly distinguishable colored markers/pens, state what areas comprise each of the following specific regions. Also explain briefly what each effect represents: (2 points each; 8 points total)
1. Consumption effect:
2. Protective effect:
3. Redistributive effect:
4. Revenue effect:
k. Refer to specific regions in the graph and explain how the society as a whole in Lambda is harmed by the tariff policy. (2 points)
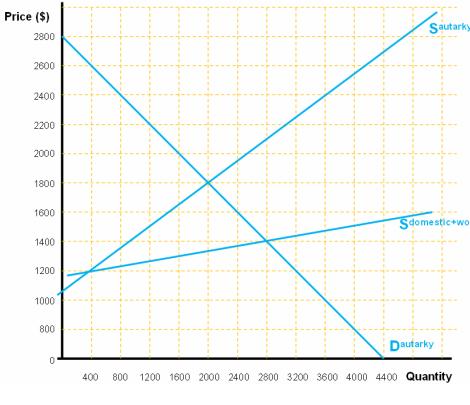
Suppose now that rather than being a small nation, Country Lambda is a large nation relative to the rest of the world such that Country Lambda may import the good based on Sdomestic+world. Additionally, suppose the domestic manufacturers of Good Z successfully lobby for trade restrictions resulting in a $200 specific tariff being placed on imports of Good Z.
m. In the graph to the right, draw and label the supply curve for Good Z available to Lambda through domestic and world production after this tariff is imposed. (2 points) n. State the numerical values for the following items. (Use approximate whole numbers based on the graph.) (1 point each; 8 points total) Pdomestic+world = _______. Qconsumed domesticallyfree trade= ____. Qproduced domesticallyfree trade= _____. # imports (free trade) = ______. Pdomestic+world+tariff = _______. Qconsumed domesticallytariff= _______. Qproduced domesticallytariff= _______. # imports (tariff) = _______. |
o. Using the letters you add to the graph and/or clearly distinguishable colored markers/pens, show and label exactly what areas comprise each of the following specific regions: (1 point each; 4 points total)
1. Consumption effect:
2. Protective effect:
3. Redistributive effect:
4. Domestic revenue effect:
p. What additional effect not listed in part (o) above is relevant in the large nations tariff model?
q. In the graph, show and label the area precisely corresponding to the effect from part (p). (2 points)
r. Compare and contrast the different types of effects caused by implementing a tariff in the small nations model vs. the large nations model. How are the outcomes predicted by the two models similar? How are the outcomes predicted by the two models different? Briefly explain. (5 points)
Graph A (Q.A~K)
Graph B (Q.M~R)
Expert Answer:


Fundamentals of Cost Accounting
ISBN: 978-0077398194
3rd Edition
Authors: William Lanen, Shannon Anderson, Michael Maher
