

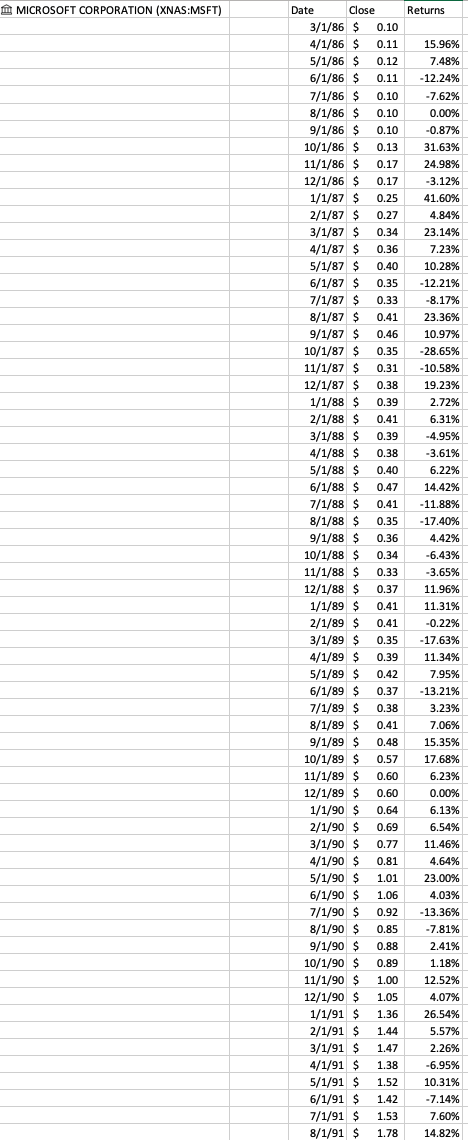
Question: Using the Microsoft stock price data on tab named MSFT on D2L , (Display the decimals as percents to two decimal places.) Assume 95% Confidence
Using the Microsoft stock price data on tab named MSFT on D2L , (Display the decimals as percents to two decimal places.) Assume 95% Confidence Interval.
a. Graph the returns data using histogram to determine if it is roughly normally distributed. Make sure to adjust number of bins and/or bin sizes for a good visual representation. Displaying the returns as percentages would be a good idea as well.
b. Choose the best graph to display the actual price (not returns) across time and graph it.
c. Calculate the mean monthly returns.
d. Calculate the standard deviation of the monthly returns.
e. Calculate the standard error of the mean.
f. What is (alpha) or the level of significance? %5
g. Using the =confidence.t() excel formula, calculate the margin of error.
h. Calculate the lower bound of the confidence interval.
i. Calculate the upper bound of the confidence interval.
j. Calculate the Degrees of Freedom.
\f
Step by Step Solution
There are 3 Steps involved in it

Get step-by-step solutions from verified subject matter experts