

Question: Using the midpoint method The following graph gives two points ( A and B ) along a hypothetical demand curve for jackfruit. table [
Using the midpoint method
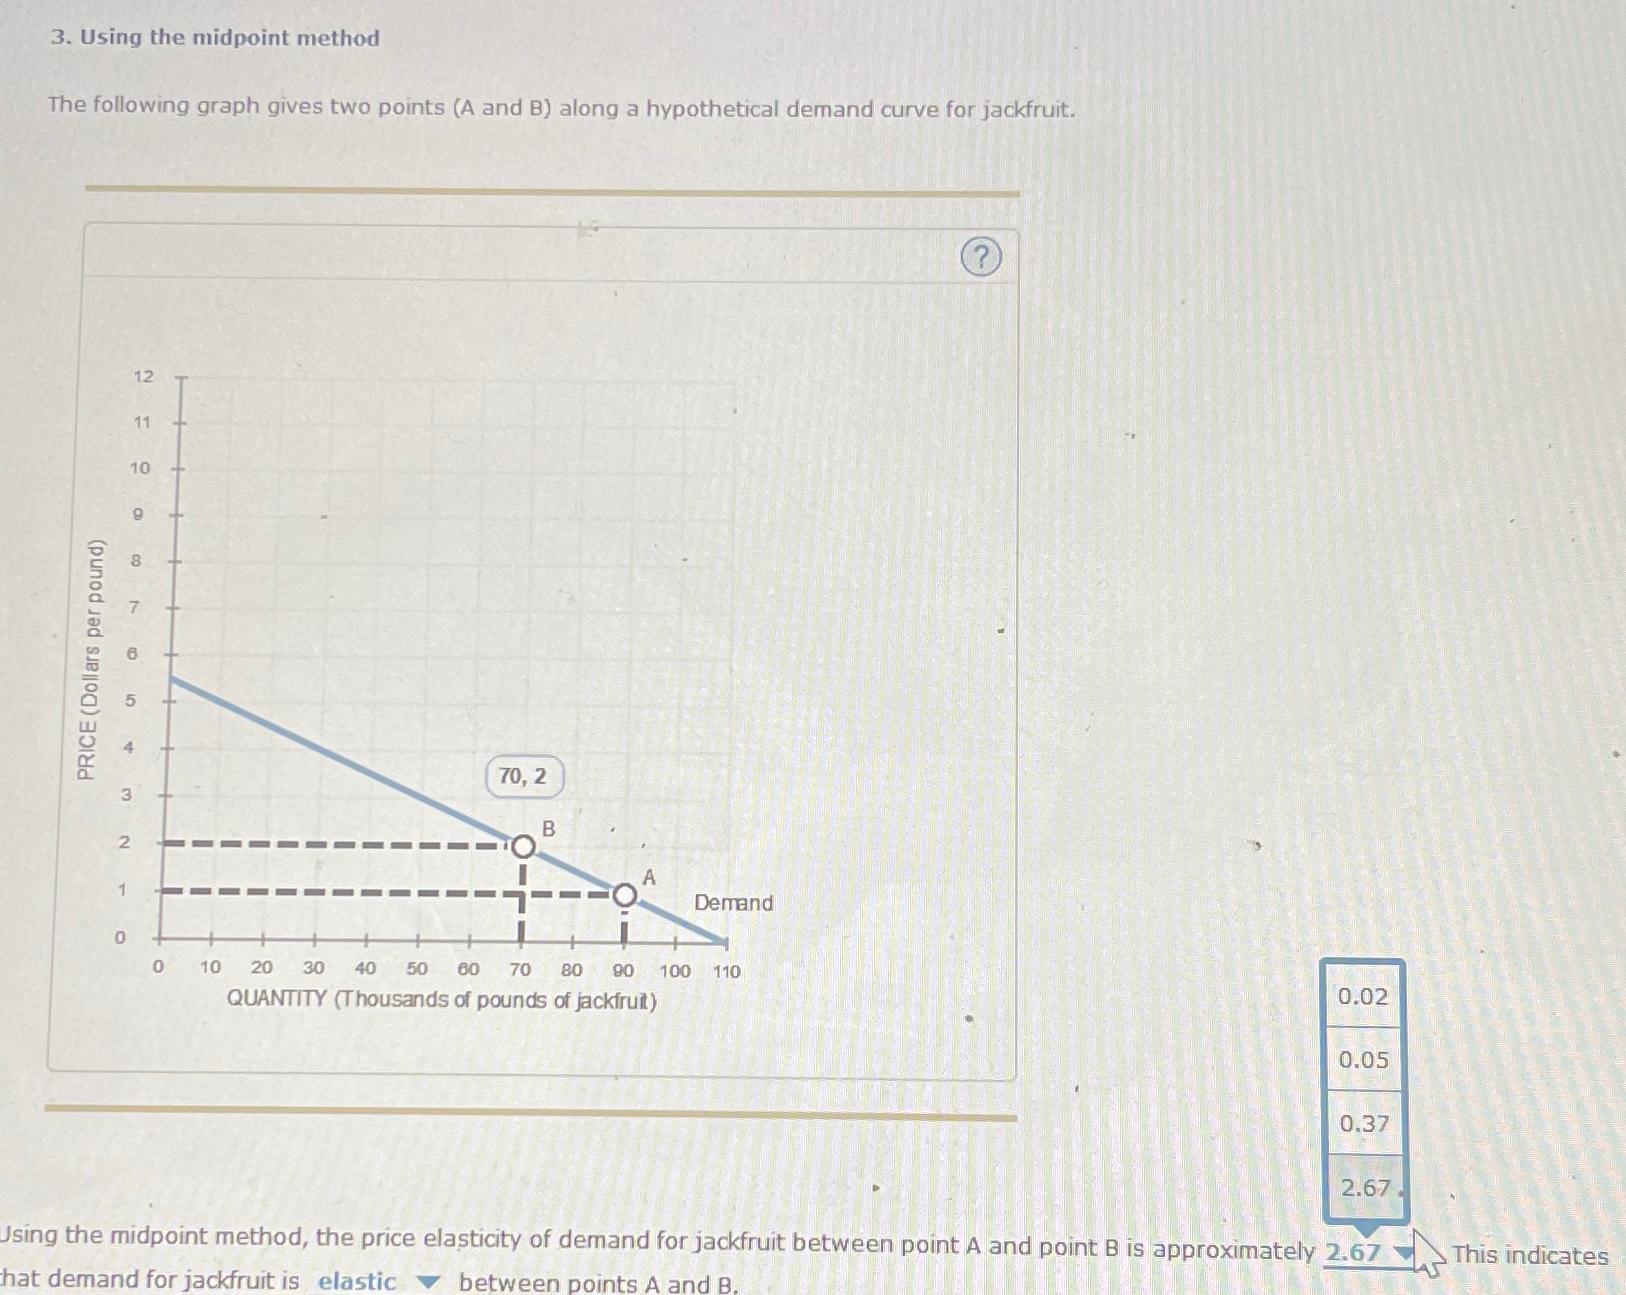
The following graph gives two points A and B along a hypothetical demand curve for jackfruit.
table
Using the midpoint method, the price elasticity of demand for jackfruit between point A and point is approximately This indicates
Step by Step Solution
There are 3 Steps involved in it
1 Expert Approved Answer
Step: 1 Unlock

Question Has Been Solved by an Expert!
Get step-by-step solutions from verified subject matter experts
Step: 2 Unlock
Step: 3 Unlock