

Question: The following graph shows two known points (X and Y) on a demand curve for oranges. 1.According to the midpoint method, the price elasticity of
The following graph shows two known points (X and Y) on a demand curve for oranges.
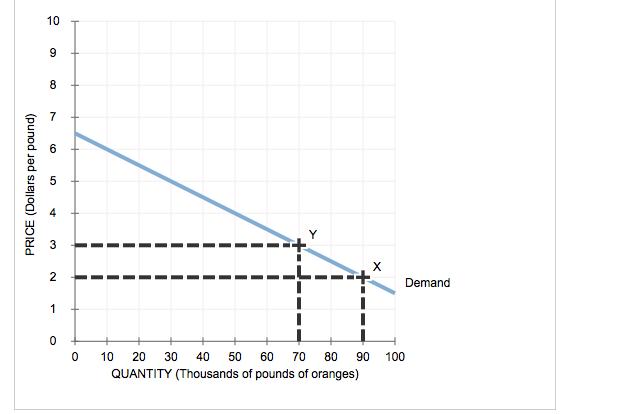
1.According to the midpoint method, the price elasticity of demand for oranges between point X and point Y is approximately (0.03, 0.05, 0.63, 1.6) , which suggests that the demand for oranges is (elastic, inelastic)between points X and Y.
10 8 3 Demand 1 10 20 30 40 50 60 70 80 90 100 QUANTITY (Thousands of pounds of oranges) PRICE (Dollars per pound)
Step by Step Solution
3.41 Rating (157 Votes )
There are 3 Steps involved in it
At point X Price 2 and Quantity 90 thousand At point Y Price 3 and Quant... View full answer

Get step-by-step solutions from verified subject matter experts