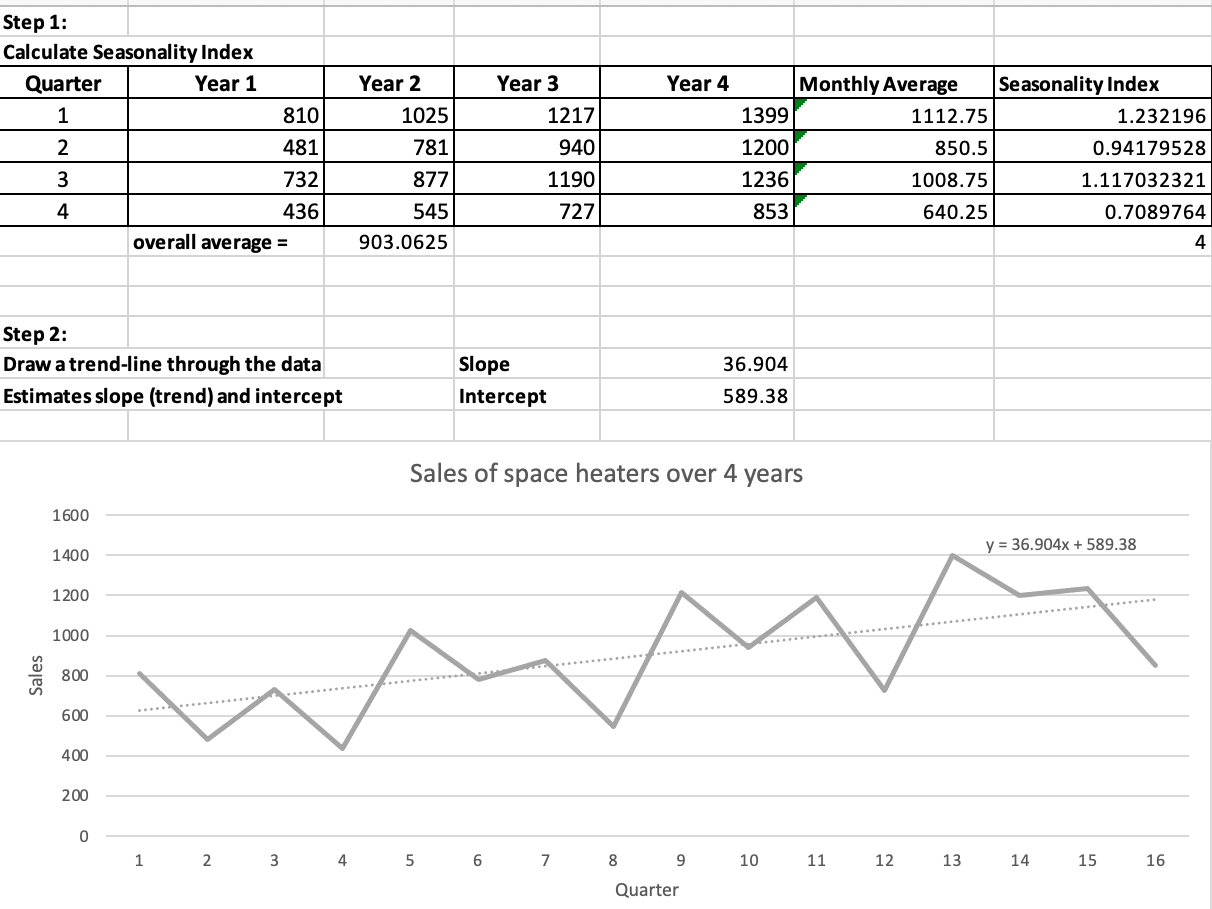
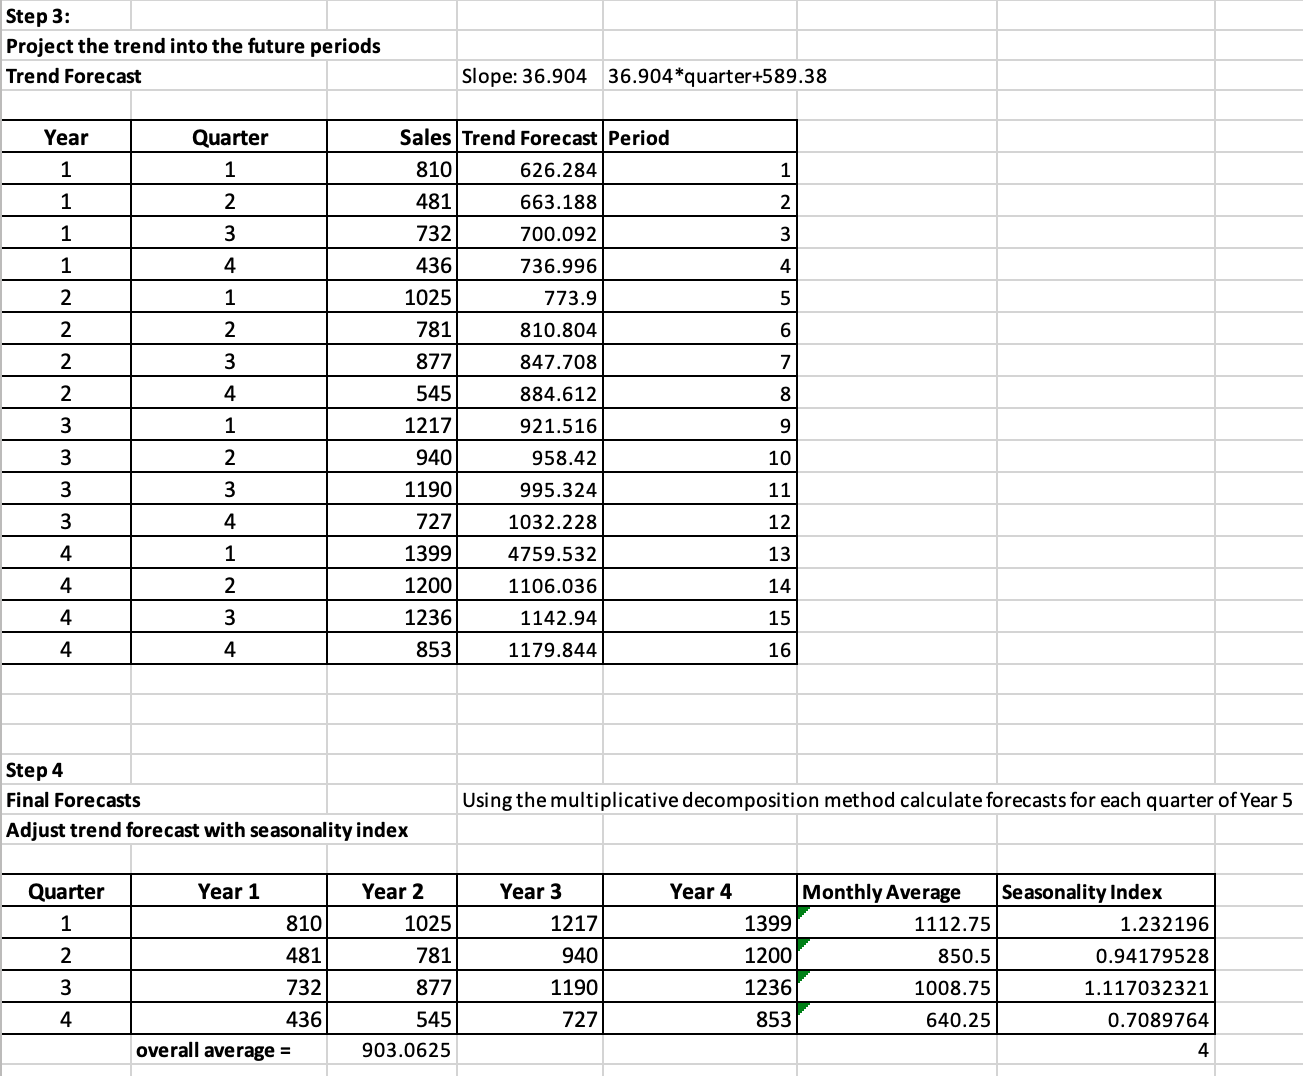
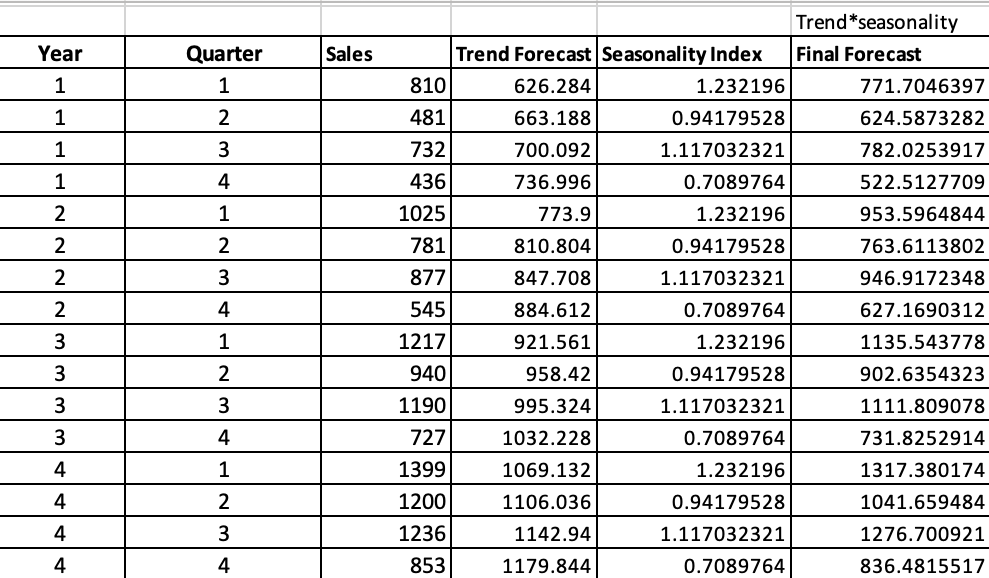
Question: Using the multiplicative decomposition method calculate forecasts for each quarter of Year 5 I am getting stuck on step 4 to then use the multiplicative

Using the multiplicative decomposition method calculate forecasts for each quarter of Year 5 I am getting stuck on step 4 to then use the multiplicative decomposition method calculate forecasts for each quarter of Year 5 / plot them

Using the multiplicative decomposition method Using the multiplicative decomposition method Using the multiplicative decomposition method

Sales of space heaters over 4 years Step 3: Project the trend into the future periods Project the tren Trend Forecast Slope: 36.90436.904 quarter +589.38 \begin{tabular}{|c|c|r|r|r|} \hline Year & Quarter & Sales & Trend Forecast & Period \\ \hline 1 & 1 & 810 & 626.284 & 1 \\ \hline 1 & 2 & 481 & 663.188 & 2 \\ \hline 1 & 3 & 732 & 700.092 & 3 \\ \hline 1 & 4 & 436 & 736.996 & 4 \\ \hline 2 & 1 & 1025 & 773.9 & 5 \\ \hline 2 & 2 & 781 & 810.804 & 6 \\ \hline 2 & 3 & 877 & 847.708 & 7 \\ \hline 2 & 4 & 545 & 884.612 & 8 \\ \hline 3 & 1 & 1217 & 921.516 & 9 \\ \hline 3 & 2 & 940 & 958.42 & 10 \\ \hline 3 & 3 & 1190 & 995.324 & 11 \\ \hline 3 & 4 & 727 & 1032.228 & 12 \\ \hline 4 & 1 & 1399 & 4759.532 & 13 \\ \hline 4 & 2 & 1200 & 1106.036 & 14 \\ \hline 4 & 3 & 1236 & 1142.94 & 15 \\ \hline 4 & 4 & 853 & 1179.844 & 16 \\ \hline \end{tabular} Step 4 Final Forecasts Using the multiplicative decomposition method calculate forecasts for each quarter of Year 5 Adjust trend forecast with seasonality index \begin{tabular}{|c|r|r|r|r|r|r|} \hline Quarter & \multicolumn{1}{|c|}{ Year 1 } & \multicolumn{1}{|c|}{ Year 2 } & Year 3 & \multicolumn{1}{|c|}{ Year 4 } & Monthly Average & Seasonality Index \\ \hline 1 & 810 & 1025 & 1217 & 1399 & 1112.75 & 1.232196 \\ \hline 2 & 481 & 781 & 940 & 1200 & 850.5 & 0.94179528 \\ \hline 3 & 732 & 877 & 1190 & 1236 & 1008.75 & 1.117032321 \\ \hline 4 & 436 & 545 & 727 & 853 & 640.25 & 0.7089764 \\ \hline & & & & & 4 \\ \hline \end{tabular} \begin{tabular}{|c|c|r|r|r|r|r} \hline Year & Quarter & \multicolumn{1}{|l|}{ Sales } & \multicolumn{2}{l|}{ Trend*seasonality } \\ \hline 1 & 1 & Trend Forecast & Seasonality Index & \multicolumn{1}{l|}{ Final Forecast } \\ \hline 1 & 2 & 810 & 626.284 & 1.232196 & 771.7046397 \\ \hline 1 & 3 & 481 & 663.188 & 0.94179528 & 624.5873282 \\ \hline 1 & 4 & 732 & 700.092 & 1.117032321 & 782.0253917 \\ \hline 2 & 1 & 436 & 736.996 & 0.7089764 & 522.5127709 \\ \hline 2 & 2 & 1025 & 773.9 & 1.232196 & 953.5964844 \\ \hline 2 & 3 & 781 & 810.804 & 0.94179528 & 763.6113802 \\ \hline 2 & 4 & 877 & 847.708 & 1.117032321 & 946.9172348 \\ \hline 3 & 1 & 545 & 884.612 & 0.7089764 & 627.1690312 \\ \hline 3 & 2 & 1217 & 921.561 & 1.232196 & 1135.543778 \\ \hline 3 & 3 & 940 & 958.42 & 0.94179528 & 902.6354323 \\ \hline 3 & 4 & 1190 & 995.324 & 1.117032321 & 1111.809078 \\ \hline 4 & 1 & 727 & 1032.228 & 0.7089764 & 731.8252914 \\ \hline 4 & 2 & 1399 & 1069.132 & 1.232196 & 1317.380174 \\ \hline 4 & 3 & 1200 & 1106.036 & 0.94179528 & 1041.659484 \\ \hline 4 & 4 & 1236 & 1142.94 & 1.117032321 & 1276.700921 \\ \hline \end{tabular}

Step by Step Solution

There are 3 Steps involved in it

1 Expert Approved Answer
Step: 1 Unlock blur-text-image
Question Has Been Solved by an Expert!

Get step-by-step solutions from verified subject matter experts

Step: 2 Unlock
Step: 3 Unlock

Students Have Also Explored These Related General Management Questions!