

Question: Using the mutual fund, benchmark and market proxy data provided in the attached spreadsheet, analyze and rank the performance of each mutual fund and their
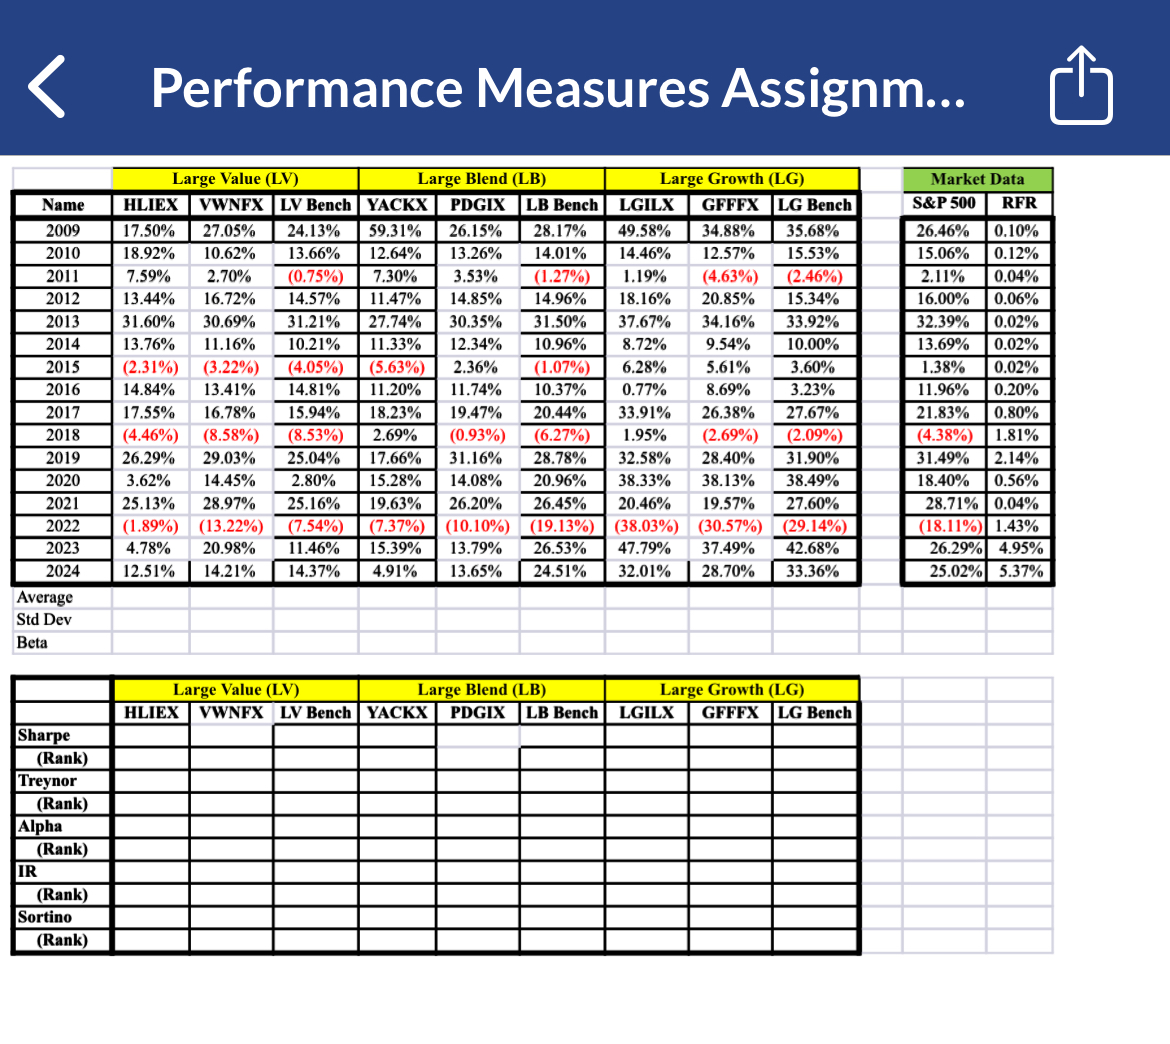
Using the mutual fund, benchmark and market proxy data provided in the attached spreadsheet, analyze and rank the performance of each mutual fund and their respective benchmarks within their specific categories as follows: A Calculate the Treynor and Sharpe ratio measures equations in slides and in the PPT for each fund and their three respective benchmarks. Use the S&P index as the market proxy RM for estimating beta. The RFR proxy is the day TBill return provided Use the sample formula in Excel for standard deviation and use the slope function to calculate beta. Note that when calculating beta, individual fund returns are alwaysassigned to the Yaxis and returns on the market proxy to the Xaxis. Organize your Sharpe and Treynor estimates in the table in the spreadsheet and rank each fund and benchmark within their category from best for each measure. B Calculate Jensens alpha for each of the six funds and three benchmarks. Use the averages you calculated previously and the modified alpha equation PPT slide to find alpha. You can use the lower equation in place of running a regression, plugging in the known values from above and solving for alpha Add your alpha estimates to the data table and rank them as you did in Part AC Compute the Information Ratio IR for each of the six funds and their benchmarks. Find the Excess Returns ERs by subtracting the overall market proxy return from the individual asset returns for each year. The average arithmetic mean for each column of Excess Returns is E in the equation PPT slide for each fund and benchmark. The standard deviation of each column of Excess Returns is the tracking error, ERuse the sample standard deviation formula to calculate it Add your IR estimates to the data table and rank them as before. D Calculate the Sortino performance measure for each mutual fund and respective benchmark PPT slides & The average arithmetic mean return for each asset is and the average arithmetic mean riskfree rate proxy return is Use for your minimum acceptable return threshold To find the semideviation DR copy the raw fund returns to a new worksheet. a Using the average return on the market as the hurdle rate, delete every annual return falling above for each fund and benchmark.
Step by Step Solution
There are 3 Steps involved in it
1 Expert Approved Answer
Step: 1 Unlock

Question Has Been Solved by an Expert!
Get step-by-step solutions from verified subject matter experts
Step: 2 Unlock
Step: 3 Unlock