

Question: using the numbers already provided on the spreadsheet, do the correct copying and pasting necceary to provide income statements and ROEs for each of the
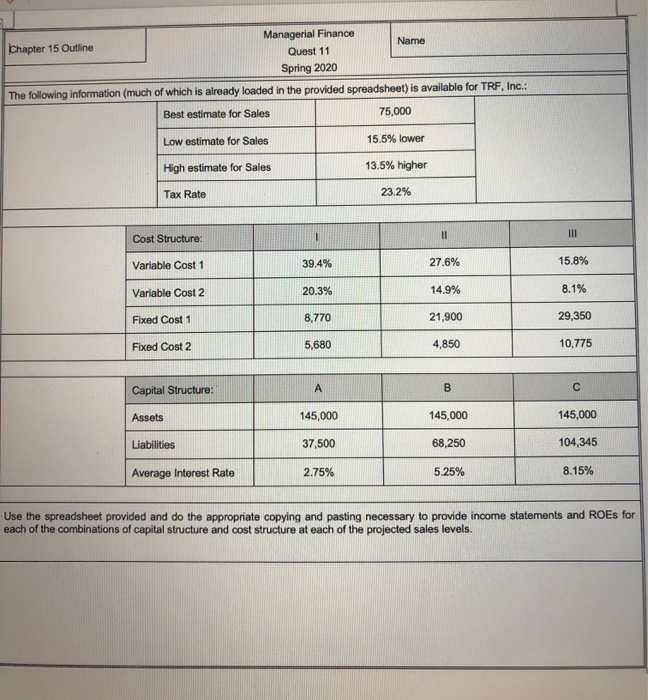
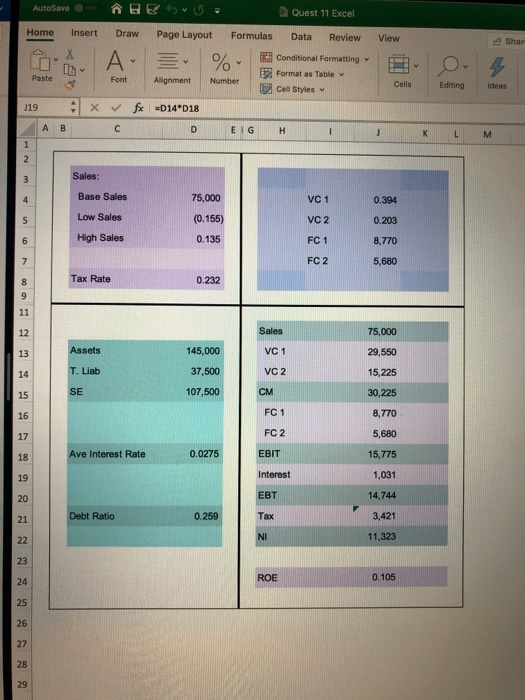
Managerial Finance Chapter 15 Outline Quest 11 Spring 2020 The following information (much of which is already loaded in the provided spreadsheet) is available for TRF, Inc.: Best estimate for Sales 75,000 Low estimate for Sales 15.5% lower 13.5% higher High estimate for Sales Tax Rate 23.2% | 39.4% 27.6% 15.8% Cost Structure: Variable Cost 1 Variable Cost 2 Fixed Cost 1 20.3% 14.9% 8.1% 8,770 21,900 29,350 Fixed Cost 2 5,680 4,850 10.775 Capital Structure: Assets 145,000 145,000 145,000 Liabilities 37,500 68,250 104,345 Average Interest Rate 2.75% 5.25% 8.15% Use the spreadsheet provided and do the appropriate copying and pasting necessary to provide income statements and ROEs for each of the combinations of capital structure and cost structure at each of the projected sales levels. View Shar AutoSave B R S Quest 11 Excel Home Insert Draw Page Layout Formulas Data Review A = % Conditional Formatting Font Format as Table Alignment Number Cell Styles 119 x fx -014*018 ABC D EIG H I Editing Ideas Sales: Base Sales 0.394 Low Sales 75,000 (0.155) 0.135 0.203 High Sales 8,770 5,680 Tax Rate 0.232 Sales 75,000 Assets 145,000 37,500 107,500 VC1 VC 2 T. Liab SE CM 29,550 15,225 30,225 8,770 5,680 FC 1 FC 2 Ave Interest Rate 0.0275 EBIT 15,775 Interest 1,031 EBT 14,744 Debt Ratio 0.259 Tax 3,421 11,323 ROE 0.105 Managerial Finance Chapter 15 Outline Quest 11 Spring 2020 The following information (much of which is already loaded in the provided spreadsheet) is available for TRF, Inc.: Best estimate for Sales 75,000 Low estimate for Sales 15.5% lower 13.5% higher High estimate for Sales Tax Rate 23.2% | 39.4% 27.6% 15.8% Cost Structure: Variable Cost 1 Variable Cost 2 Fixed Cost 1 20.3% 14.9% 8.1% 8,770 21,900 29,350 Fixed Cost 2 5,680 4,850 10.775 Capital Structure: Assets 145,000 145,000 145,000 Liabilities 37,500 68,250 104,345 Average Interest Rate 2.75% 5.25% 8.15% Use the spreadsheet provided and do the appropriate copying and pasting necessary to provide income statements and ROEs for each of the combinations of capital structure and cost structure at each of the projected sales levels. View Shar AutoSave B R S Quest 11 Excel Home Insert Draw Page Layout Formulas Data Review A = % Conditional Formatting Font Format as Table Alignment Number Cell Styles 119 x fx -014*018 ABC D EIG H I Editing Ideas Sales: Base Sales 0.394 Low Sales 75,000 (0.155) 0.135 0.203 High Sales 8,770 5,680 Tax Rate 0.232 Sales 75,000 Assets 145,000 37,500 107,500 VC1 VC 2 T. Liab SE CM 29,550 15,225 30,225 8,770 5,680 FC 1 FC 2 Ave Interest Rate 0.0275 EBIT 15,775 Interest 1,031 EBT 14,744 Debt Ratio 0.259 Tax 3,421 11,323 ROE 0.105
Step by Step Solution
There are 3 Steps involved in it

Get step-by-step solutions from verified subject matter experts