

Question: Using the Pivot Table that illustrates the relationship between Total Purchases and Annual Income, answer the questions below. What trends do you see in the
Using the Pivot Table that illustrates the relationship between Total Purchases and Annual Income, answer the questions below.
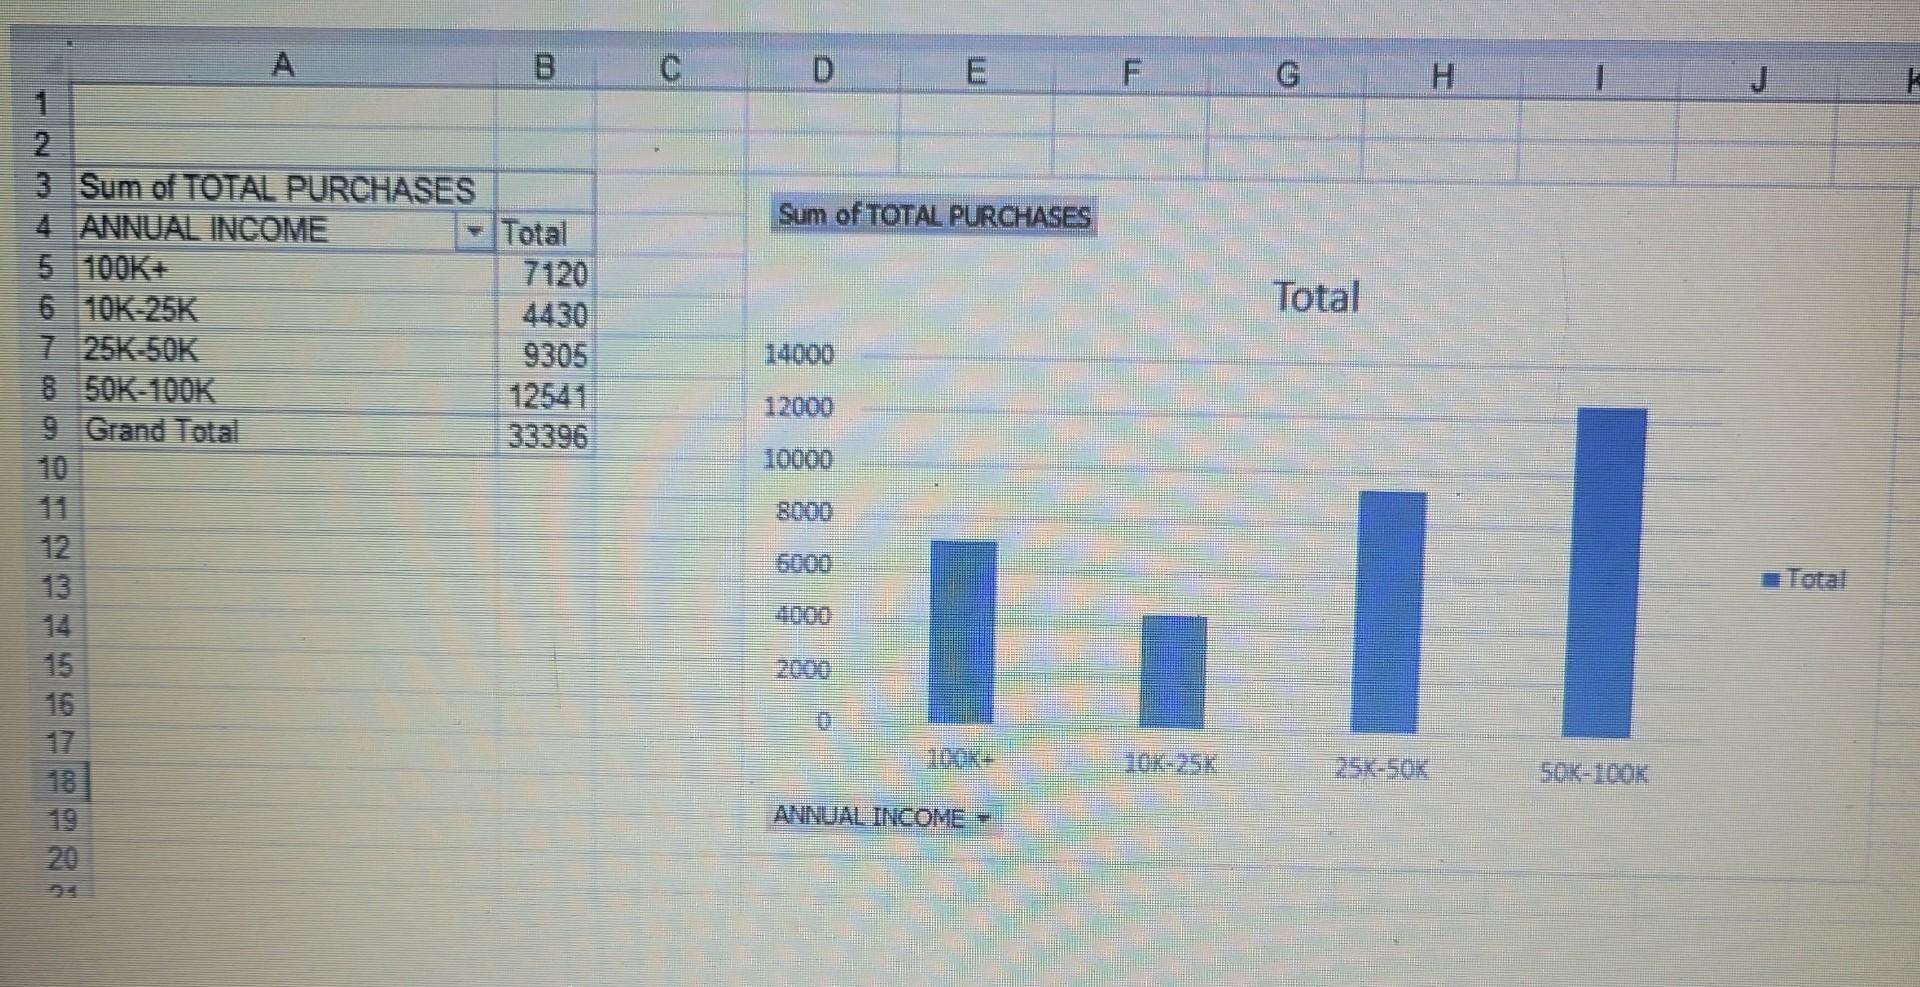
What trends do you see in the information? Suppose your task is to concentrate marketing efforts and resources. On which annual income level would you concentrate? Why? If you were a marketing manager, what additional information would be helpful as you make your decision? Where would you be able to obtain such information?
Notice that the 50K-100K makes the most total purchases, not 100K+, the highest level. This may mean that you need to do more high-end marketing.
Other information that would be helpful would include customers by zip code, customers by proximity to competitors, and so on. Most of this type of information can be obtained from the Census Bureau
ANNUAL INCOME = ANNUAL INCOME =
Step by Step Solution
There are 3 Steps involved in it

Get step-by-step solutions from verified subject matter experts