

Question: Using the process information provided in Problem 3-15, construct an -chart in conjunction with the R-chart, plot the sample observations provided in part (b), and,
Using the process information provided in Problem 3-15, construct an -chart in conjunction with the R-chart, plot the sample observations provided in part (b), and, using both - and R-charts, comment on the process control.
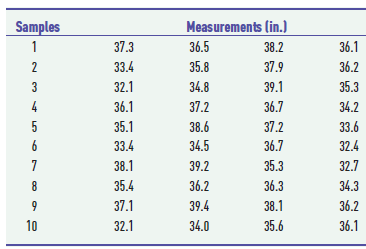
\begin{tabular}{ccccc} \hline Samples & \multicolumn{4}{c}{ Measurements (in.) } \\ \hline 1 & 37.3 & 36.5 & 38.2 & 36.1 \\ 2 & 33.4 & 35.8 & 37.9 & 36.2 \\ 3 & 32.1 & 34.8 & 39.1 & 35.3 \\ 4 & 36.1 & 37.2 & 36.7 & 34.2 \\ 5 & 35.1 & 38.6 & 37.2 & 33.6 \\ 6 & 33.4 & 34.5 & 36.7 & 32.4 \\ 7 & 38.1 & 39.2 & 35.3 & 32.7 \\ 8 & 35.4 & 36.2 & 36.3 & 34.3 \\ 9 & 37.1 & 39.4 & 38.1 & 36.2 \\ 10 & 32.1 & 34.0 & 35.6 & 36.1 \\ \hline \end{tabular}
Step by Step Solution
There are 3 Steps involved in it

Get step-by-step solutions from verified subject matter experts