

Question: Using the provided data, create a spreadsheet for each estimation method: high - low method and regression. Create the data i n a chart, show
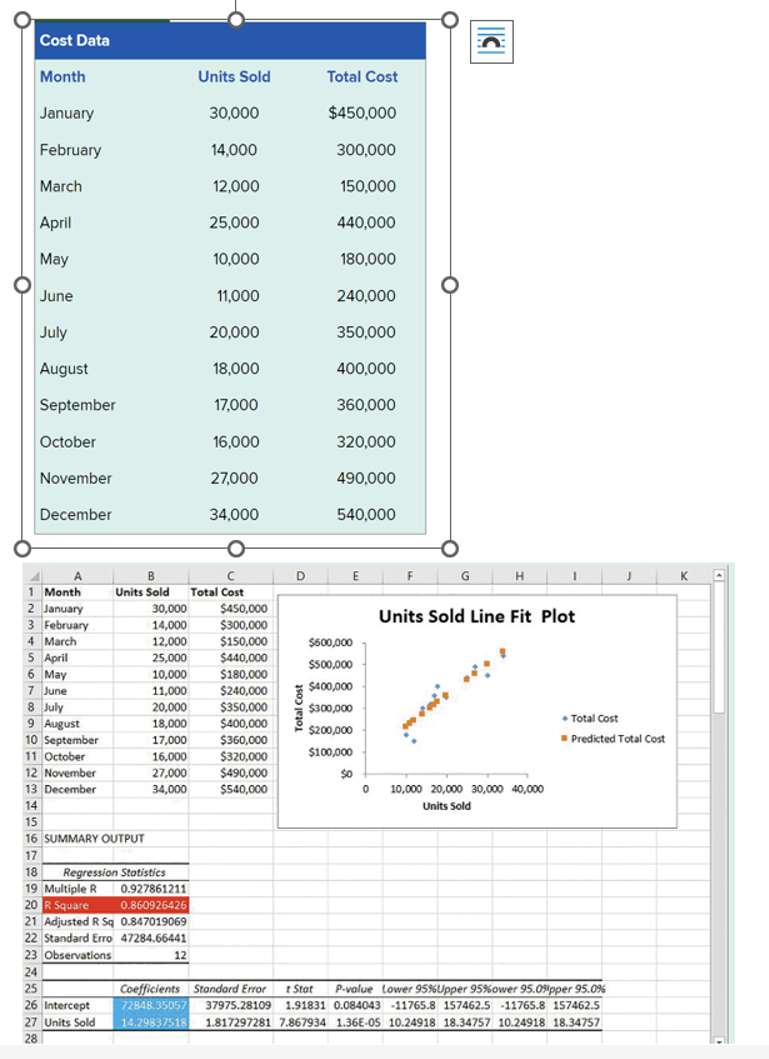
Using the provided data, create a spreadsheet for each estimation method: highlow method and regression. Create the data a chart, show your calculations words and numbers don't just show the numbers; show the formula well and certain tie your results those the textbook. Compare the results the two methods for variable cost components and fixed cost components.
Now that you have the hang drop off the month December from your calculations. Using only the months data Nov new worksheet calculate again using the highlow method and the regression method
Step by Step Solution
There are 3 Steps involved in it
1 Expert Approved Answer
Step: 1 Unlock

Question Has Been Solved by an Expert!
Get step-by-step solutions from verified subject matter experts
Step: 2 Unlock
Step: 3 Unlock