

Question: Using the provided Income Statement worksheet and create a one-page analysis of what the data presented shows. Address the following questions in your analysis: What
Using the provided Income Statement worksheet and create a one-page analysis of what the data presented shows. Address the following questions in your analysis:
What data is provided?
What does the data show us?
Can you identify any trends?
Is there any data that could have been added to make a stronger report?
Do you have any recommendations to the business owners?
What did you learn from this activity?
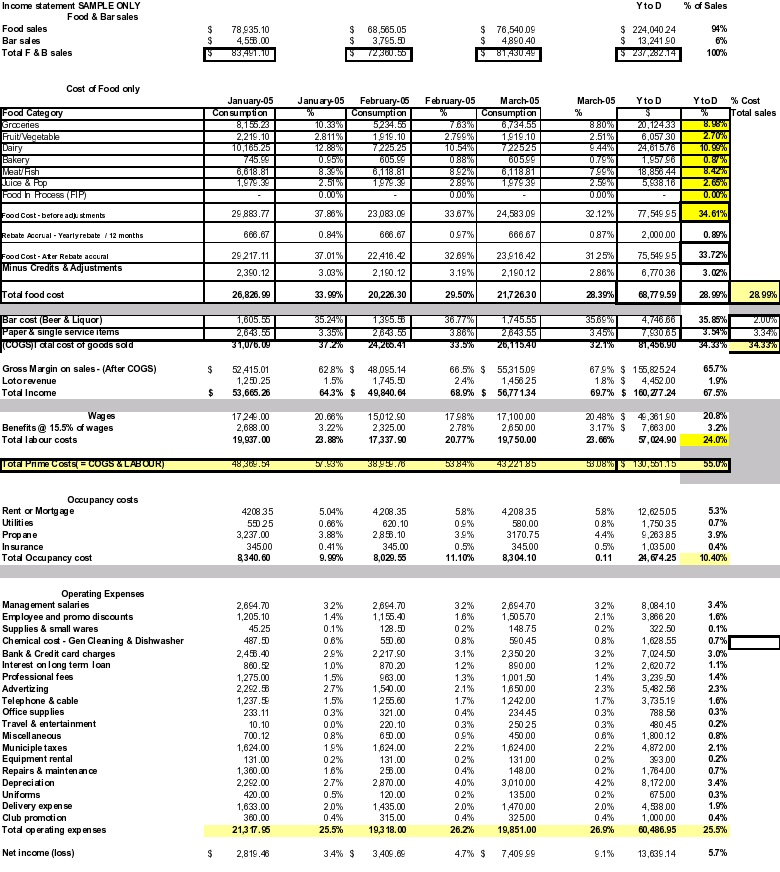
YtoD % of Sales Income statement SAMPLE ONLY Food & Bar sales Food sales Bar sales Total F&B sales $ $ $ 78,935.10 4,55.00 83,491.10 $ $ $ 68,585.05 3,795.50 72 300.36 $ 76,540.09 $ 4,890.40 $ 81,43049 $ 224,040 24 $ 13,241.90 $ 237.282.14 94% 6% 100% Cost of Food only March-05 January-05 Consumption 8,150.23 2,219.10 10.105125 745.4 6,618.81 1,979.39 Food Category Groceries Fruit/Vegetable Dairy Bakery Meash JUOD & Hop Food n Hocess (FIP) January 05 February 06 Consumption 10.33% 524.80 2.811% 1.919.10 12.8% 7.225.25 0.95% 605.99 8.39% 6,118.81 2.51% 1.97.39 0.00% February-05 March-05 Consumption 7.03% 6,734.55 2.799% 1.919.10 10.54% 7.22525 088% 605.99 8920 6,11881 289% 1.97939 0.00% 880% 2.51% 46 Yto D $ 20,12433 6,057 30 24.01570 1,95796 18,850.44 5,638.10 YtoD % Cost Total sales 8.98% 2.70% 10.99% 8.42-10 2.66% 0.00% U100% Food Cost-before adjustments 29.883.77 37.88% 23,083.00 33.67% 24,583.09 32.12% 77,549 95 34.61% Rebate Accrual - Yearly rebate / 12 months 668.67 0.84% 668.67 0.97% 666.67 0 87% 2,000.00 0.89% Food Cost - Ater Rebabe accural Minus Credits & Adjustments 29 2 17.11 2,390.12 37.01% 3.03% 22,416.42 2.190.12 32.69% 3.19% 23,916.42 2,190.12 31 25% 2 86% 75,549.95 6,770 36 33.72% 3.02% Total food cost 26,826.99 33.99% 20,226.30 29.50% 21,726.30 28.39% 68,779.59 28.99% 28 99% Bar cost (Beer & Liquor Paper & single service items COGS al cost of goods sad 1,605.30 2,643.36 31,076.09 35.24% 3.35% 37.210 1395.38 2.643.36 24,200.41 36.77% 3 86 33.5% 1,745.55 2.643.55 26,15.40 3569% 3456 3215 4,746.66 7,8301015 81,456.90 35.85% 3.54% 34.38% 2.UU 3.34% 34.35110 $ Gross Margin on sales - (After COGS) Lotorevenue Total Income 52.415.01 1.250.25 53,666.26 628% $ 1.5% 64.3% $ 48,095.14 1,745.50 49,840.64 66.5% $ 55,315.09 2.4% 1,458 25 68.9% $ 56,771.34 679% $ 155,82524 18% $ 4,452 00 69.7% $ 160,277.24 65.7% 1.9% 67.5% $ Wages Benefits @ 15.5% of wages Total labour costs 17 249.00 2,688.00 19,937.00 20.68% 3.22% 23.88% 15,012.90 2.325.00 17,337.90 17.98% 2.78% 20.77% 17,100.00 2,650.00 19,750.00 20.48% $ 3.17% $ 23.66% 43,381.90 7,683.00 57, 024.90 20.8% 3.2% 24.0% Tota Prime Costa FCOGS&LABOURJ 48308.54 57.959 38,959.70 55 84% 4322185 531089 130,501115 55.0 Occupancy costs Rent or Mortgage Utilities Propane Insurance Total Occupancy cost 4208 35 550 25 3,237.00 345.00 8340.60 5.04% 0.68% 3.88% 0.41% 9.99% 4208.35 620.10 2.858.10 345.00 8,029.55 5.8% 0.9% 3.9% 0.5% 11.10% 420835 580.00 3170.75 345.00 8,304.10 5.8% 0.8% 4.4% 0.5% 0.11 12,625.05 1,750 35 9,263 85 1,035.00 24,674.25 5.3% 0.7% 3.9% 0.4% 10.40% 32% 1.4% 0.1% 0.6% 2.9% Operating Expenses Management salaries Employee and promo discounts Supplies & small wares Chemical cost-Gen Cleaning & Dishwasher Bank & Credit card charges Interest on long term loan Professional fees Advertizing Telephone & cable Office supplies Travel & entertainment Miscellaneous Municiple taxes Equipment rental Repairs & maintenance Depreciation Uniforms Delivery expense Club promotion Tota operating expenses 2,694.70 1,205.10 45.25 487.50 2,458.40 880.52 1,275.00 2.262.5 1,237.5 233.11 10.10 700.12 1,624.00 131.00 1,300.00 2.282.00 420.00 1,633.00 380.00 21,3 17.96 1.0% 1.5% 2.7% 1.5% 03% 0.0% 0.8% 1.9% 02% 1.6% 2.7% 0.5% 2.0% 0.4% 25.5% 2,694.70 1,155.40 128.50 550.60 2217.90 870.20 963.00 1,540.00 1255.60 321.00 220.10 650.00 1,624.00 131.00 258.00 2.870.00 120.00 1.435.00 315.00 19,3 18.00 32% 1.6% 02% 0.8% 3.1% 12% 13% 2.1% 1.7% 0.4% 0.3% 0.9% 22% 02% 0.4% 4.0% 02% 2.0% 0.4% 2.694.70 1,505.70 148.75 500.45 2,350 20 890.00 1.001.50 1.650 00 1 242.00 234.45 250 25 450.00 1,624.00 131.00 148.00 3,010.00 135.00 1.470.00 325.00 19,851.00 32% 2.1% 02% 0.8% 32% 12% 1.4% 23% 1.7% 03% 03% 0.8% 22% 02% 02% 42% 02% 2.0% 0.4% 26.9% 8,084.10 3,886 20 322.50 1,628.55 7,024.50 2.620.72 3,239.50 5.482.58 3,735.19 788.56 480.45 1.800.12 4,872.00 393.00 1,764.00 8,172.00 675.00 4,538.00 1,000.00 60,486.95 3.4% 1.6% 0.1% 0.7% 3.0% 1.1% 1.4% 2.3% 1.6% 0.3% 0.2% 0.8% 2.1% 0.29% 0.7% 3.4% 0.3% 1.9% 0.4% 25.5% 26.2% Net income (loss) $ 2,819.43 3.4% $ 3,409.00 4.7% $ 7,409.99 9.1% 13,639.14 5.7% YtoD % of Sales Income statement SAMPLE ONLY Food & Bar sales Food sales Bar sales Total F&B sales $ $ $ 78,935.10 4,55.00 83,491.10 $ $ $ 68,585.05 3,795.50 72 300.36 $ 76,540.09 $ 4,890.40 $ 81,43049 $ 224,040 24 $ 13,241.90 $ 237.282.14 94% 6% 100% Cost of Food only March-05 January-05 Consumption 8,150.23 2,219.10 10.105125 745.4 6,618.81 1,979.39 Food Category Groceries Fruit/Vegetable Dairy Bakery Meash JUOD & Hop Food n Hocess (FIP) January 05 February 06 Consumption 10.33% 524.80 2.811% 1.919.10 12.8% 7.225.25 0.95% 605.99 8.39% 6,118.81 2.51% 1.97.39 0.00% February-05 March-05 Consumption 7.03% 6,734.55 2.799% 1.919.10 10.54% 7.22525 088% 605.99 8920 6,11881 289% 1.97939 0.00% 880% 2.51% 46 Yto D $ 20,12433 6,057 30 24.01570 1,95796 18,850.44 5,638.10 YtoD % Cost Total sales 8.98% 2.70% 10.99% 8.42-10 2.66% 0.00% U100% Food Cost-before adjustments 29.883.77 37.88% 23,083.00 33.67% 24,583.09 32.12% 77,549 95 34.61% Rebate Accrual - Yearly rebate / 12 months 668.67 0.84% 668.67 0.97% 666.67 0 87% 2,000.00 0.89% Food Cost - Ater Rebabe accural Minus Credits & Adjustments 29 2 17.11 2,390.12 37.01% 3.03% 22,416.42 2.190.12 32.69% 3.19% 23,916.42 2,190.12 31 25% 2 86% 75,549.95 6,770 36 33.72% 3.02% Total food cost 26,826.99 33.99% 20,226.30 29.50% 21,726.30 28.39% 68,779.59 28.99% 28 99% Bar cost (Beer & Liquor Paper & single service items COGS al cost of goods sad 1,605.30 2,643.36 31,076.09 35.24% 3.35% 37.210 1395.38 2.643.36 24,200.41 36.77% 3 86 33.5% 1,745.55 2.643.55 26,15.40 3569% 3456 3215 4,746.66 7,8301015 81,456.90 35.85% 3.54% 34.38% 2.UU 3.34% 34.35110 $ Gross Margin on sales - (After COGS) Lotorevenue Total Income 52.415.01 1.250.25 53,666.26 628% $ 1.5% 64.3% $ 48,095.14 1,745.50 49,840.64 66.5% $ 55,315.09 2.4% 1,458 25 68.9% $ 56,771.34 679% $ 155,82524 18% $ 4,452 00 69.7% $ 160,277.24 65.7% 1.9% 67.5% $ Wages Benefits @ 15.5% of wages Total labour costs 17 249.00 2,688.00 19,937.00 20.68% 3.22% 23.88% 15,012.90 2.325.00 17,337.90 17.98% 2.78% 20.77% 17,100.00 2,650.00 19,750.00 20.48% $ 3.17% $ 23.66% 43,381.90 7,683.00 57, 024.90 20.8% 3.2% 24.0% Tota Prime Costa FCOGS&LABOURJ 48308.54 57.959 38,959.70 55 84% 4322185 531089 130,501115 55.0 Occupancy costs Rent or Mortgage Utilities Propane Insurance Total Occupancy cost 4208 35 550 25 3,237.00 345.00 8340.60 5.04% 0.68% 3.88% 0.41% 9.99% 4208.35 620.10 2.858.10 345.00 8,029.55 5.8% 0.9% 3.9% 0.5% 11.10% 420835 580.00 3170.75 345.00 8,304.10 5.8% 0.8% 4.4% 0.5% 0.11 12,625.05 1,750 35 9,263 85 1,035.00 24,674.25 5.3% 0.7% 3.9% 0.4% 10.40% 32% 1.4% 0.1% 0.6% 2.9% Operating Expenses Management salaries Employee and promo discounts Supplies & small wares Chemical cost-Gen Cleaning & Dishwasher Bank & Credit card charges Interest on long term loan Professional fees Advertizing Telephone & cable Office supplies Travel & entertainment Miscellaneous Municiple taxes Equipment rental Repairs & maintenance Depreciation Uniforms Delivery expense Club promotion Tota operating expenses 2,694.70 1,205.10 45.25 487.50 2,458.40 880.52 1,275.00 2.262.5 1,237.5 233.11 10.10 700.12 1,624.00 131.00 1,300.00 2.282.00 420.00 1,633.00 380.00 21,3 17.96 1.0% 1.5% 2.7% 1.5% 03% 0.0% 0.8% 1.9% 02% 1.6% 2.7% 0.5% 2.0% 0.4% 25.5% 2,694.70 1,155.40 128.50 550.60 2217.90 870.20 963.00 1,540.00 1255.60 321.00 220.10 650.00 1,624.00 131.00 258.00 2.870.00 120.00 1.435.00 315.00 19,3 18.00 32% 1.6% 02% 0.8% 3.1% 12% 13% 2.1% 1.7% 0.4% 0.3% 0.9% 22% 02% 0.4% 4.0% 02% 2.0% 0.4% 2.694.70 1,505.70 148.75 500.45 2,350 20 890.00 1.001.50 1.650 00 1 242.00 234.45 250 25 450.00 1,624.00 131.00 148.00 3,010.00 135.00 1.470.00 325.00 19,851.00 32% 2.1% 02% 0.8% 32% 12% 1.4% 23% 1.7% 03% 03% 0.8% 22% 02% 02% 42% 02% 2.0% 0.4% 26.9% 8,084.10 3,886 20 322.50 1,628.55 7,024.50 2.620.72 3,239.50 5.482.58 3,735.19 788.56 480.45 1.800.12 4,872.00 393.00 1,764.00 8,172.00 675.00 4,538.00 1,000.00 60,486.95 3.4% 1.6% 0.1% 0.7% 3.0% 1.1% 1.4% 2.3% 1.6% 0.3% 0.2% 0.8% 2.1% 0.29% 0.7% 3.4% 0.3% 1.9% 0.4% 25.5% 26.2% Net income (loss) $ 2,819.43 3.4% $ 3,409.00 4.7% $ 7,409.99 9.1% 13,639.14 5.7%
Step by Step Solution
There are 3 Steps involved in it

Get step-by-step solutions from verified subject matter experts