

Question: Using the provided Income Statement worksheet and create a one-page analysis of what the data presented shows. Address the following questions in your analysis: What
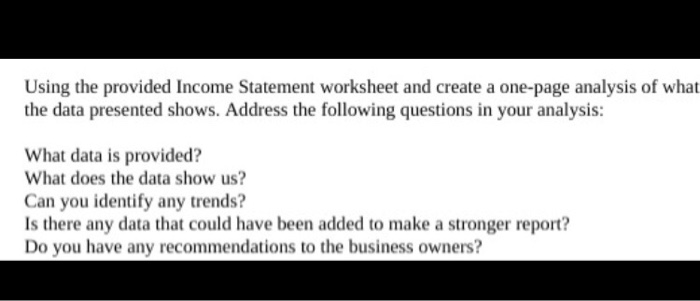
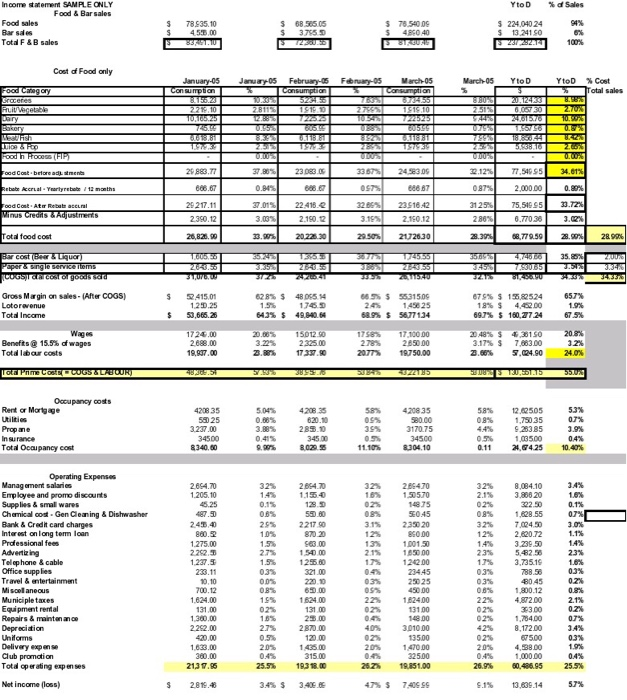
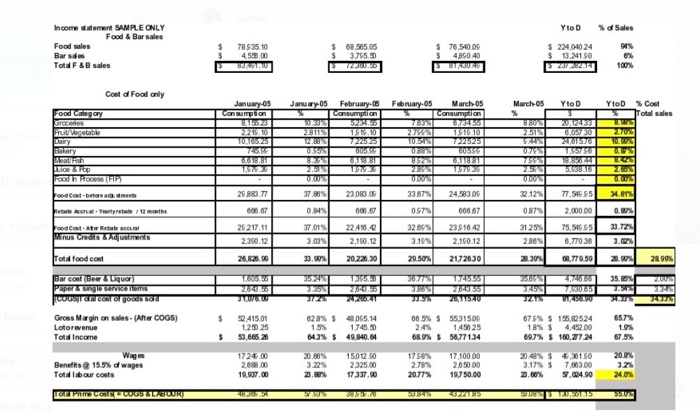
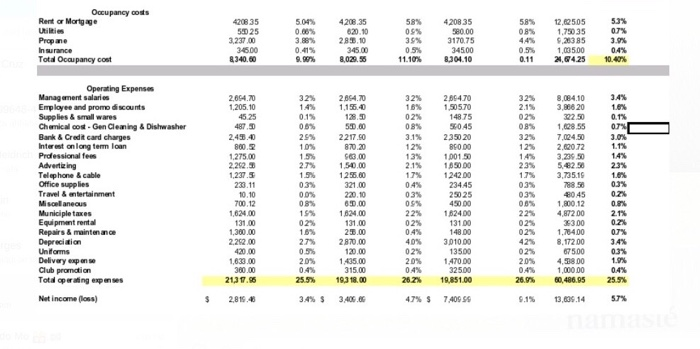
Using the provided Income Statement worksheet and create a one-page analysis of what the data presented shows. Address the following questions in your analysis: What data is provided? What does the data show us? Can you identify any trends? Is there any data that could have been added to make a stronger report? Do you have any recommendations to the business owners? YtoD % of Sales Income statement SAMPLE ONLY Food & Bar sales Food sales Barsales Total F&B sales 94% 78.535.10 450.00 BUNU 68.565.05 3.755.0 $ 78,5400 $ 480 40 BIFURS $ 224.040 24 $ 13.241 0 100% Cost of Food only March05 January-05 Consumption January 05 February-06 February-05 March-05 Consumption Consumption Yto D Yton Coot 3 Total sales 8.9896 221.10 10.106.25 28115 12 19150 720ST 1919.10 TANT FOGO Cregory Groceries Fruit Vegetable Dary Bakery MESSE LT10 RTO Food h Hoces (FIP) 6.08 30 241570 1.56756 19939 26 URUST 3367 235551 UUS 22.12% 23 083 2483 77.54695 34.01% Food Cost before ad stments Retete crYearly the months 29 883.77 660.67 0.90 66667 097% 0.00% Food Cont Ater Rebase Minus Credits Adjustments 33.72% 29 217.11 230.12 22.418. 2.150.2 23.516.42 2.10.12 2,000.00 75,516 95 6.770.30 3125% 286 3,03% 3.02% 3.10 29.50 Total food cost 26,820.00 33.90 20.228.30 20726.30 28.39% 68.779.59 28.50% 28.90 35.0 2000 Bar cost (Beer Paper & single service items CUGSTRICSSR T600 2893.50 30. 2563551 ZAVRU 310333 $ 52.415.01 120.25 53,668.26 628% $ 48 DS5 14 1.5% 174.D 643% $ 49.840.64 67% $ 12,82524 18% $ 4.452.00 69.7% $ 160,724 657% 1.9% 675% $ Gross Margin on sales - (Alter COGS) Lotorevenue Total Income Wages Benefits @ 15.5% of wages Totd labour costs o Prime CECOGS LICOR 66.5% $ 55315.00 24% 1.456 25 68.9% $ 5677134 1758 17.100.00 278% 2.650.00 2077 19750,00 1724.00 2688.00 19.037.00 3.22% 23.95 150 12.50 2325.00 17 337.90 3.17% S 23.66% 7.663.00 5.624.90 20.8% 3.2% 24.0% 40362.51 SURSUZ2135 BUYERS 550 58% Occupancy costs Rent or Mortgage Utilities Propane Insurance Total Ocalpancy cost 420835 58025 3.237.00 34500 8340.00 5,04% 0.68% 3.88% 4208.35 620.10 285.10 345.00 58% OS 35% 420835 580.00 3170.75 12.02505 1,750.35 28385 1,03500 24.64.25 0.8% 44% 0.5% 0.11 5.3% 0.7% 3.9% 0.4% 10.40% 34500 11.10% 8304.10 2654.70 1.205.10 45.25 32% 1.4% 0.15 2654.70 1.150 32 16% 32% 2.1% 02% 08% 550.60 2217 50 870.20 295 10% 1.55 27% 32% 3.15 12% 135 2.15 12% 23 Operating Expenses Management salaries Employee and promo discounts Supplies & smalwares Chemical cost-Gen Cleaning & Dishwasher Bank & Credit card charges Interest on long term loan Professional fees Advertising Telephone & cable Office supplies Travel & entertainment Misoolaneous Municiple taxes Equipment rental Repairs & maintenance Depreciation Uniforms Delivery expense Club promotion Total operating expenses 1.540.00 125600 321.00 2200 243.40 860.2 1.275.00 2.262.5 1.237.5 233.11 10.10 700.12 1.624.00 131.00 1.300.00 2252.00 420.00 1.633.00 300.00 2137.96 1.7% 0.3% 0.3% 2.86470 1.50570 14875 560.45 2350 20 850.00 1.00150 1650.00 120.00 23445 250 25 450.00 1.824.00 13100 148.00 3.010.00 135.00 1.470.00 325.00 19.051.00 0.3% 00% 08% 1.9% 02% 18% 27% 0.5% 20% 0.4% 25.5% 8.084.10 3.800 20 322.50 1.628.55 7.624.30 2.620.72 3.239.50 5.42.50 3.735.10 788.56 8045 1.800.12 4,872.00 33.00 1.784.00 8.172.00 675.00 4.38.00 1.000.00 60.486.95 34% 1.6% 0.1% 0.7% 3.0% 1.1% 14% 2.3% 1.6% 0.3% 0.2% 0.8% 2.1% 0.2% 0.7% 3.4% 0.3% 1.9% 0.4% 25.5% 225 02% 13100 23.00 2.870.00 120.00 1.435.00 315.00 19318.00 22% 02% 02% 42% 02% 2.0% 02 20% 26.26 26.9% Net income foss) $ 2819.46 3.4% 5 3.40.BE 7.405 SS 5.1% 13.636.14 57% Yton %d Sales Income statement SAMPLE ONLY Food & Bar sales Food sales Barsales Total F&B sales 78 535.10 $ 68.505.05 3765. $ 78,540 D $ 4850 40 SISUS $ 224,040 24 $ 13,24150 0% 100% BU Cost of Food only Yto D January 05 Consumption March 05 % Yton January 05 February 05 Consumption Cost Total sales 20112033 February 05 March Consumption 6,734.55 1919.10 TUESIS 7220201 GBBT 2009 170930 U. 07551 20170 1,557501 1572 6980 Food Cinegory Groceries Huit Vegetabb Dairy ry Health PUIGPUP Food in House (FIP) Food Costborstens beberal - Yartyretube/ 12 months Food Cost - Ate Rebab accural Minus Credits Austers 000 37.86% 29883.77 23.083.00 33 67% 24,5830 32.125 77,54695 34.678 0.84% 600.67 097 0875 2.000.00 0.8% 26 217.11 2,390.12 37.01% 3.00% 2249. 2.160.12 32 3.18% 666 67 235 18 42 2.160.12 3125% 288 75,546 6,77036 33.770 3. Total food cost 26.820.00 20.220.30 20.50 21726.30 28.39% 68.779.59 23.9 28 99 35. Bar cost (Beer & Liquor Paper & single sevke Toms COUSIGRICOSTI GOUSSE 2000 HAN 23.30 31 23551 125 325 3215 71 3154909 Gross Margin on sales. After COGS) Lotorevenue Total income 2415.01 120.25 50.665.26 628% $ 48065.14 1.5% 1.745.50 64.3% S 49.840.04 68.5% $ 55,31509 24% 1458 25 68.9% $ 56,77134 678% $ 155,82524 18% 5 4.452.00 69.7% $ 160,2724 65.7% 1.9% 675 Wages Benefits 15.5% of wages Tota labour costs 1724.00 2.688.00 19.07.00 20.00% 3.22% 15.012.50 2.325.00 17337.00 1758% 2.78% 20.77% 17,100.00 2.65000 19.750.00 3.17% 5 7.663.00 5.04.00 20.8% 3.2% 24.0% IGE PAT CORECOGS ZILABOUR) 252185 USORES 20 5.8% 08% Occupancy costs Rent or Mortgage Propane Insurance Total Ocupancy cost 420835 50 25 3.237.00 346.00 8340.60 5.04% 0.00% 3.88% 0.41% 4208.35 620.10 28.10 345.00 8.020.58 58% 09% 39% 0.5% 11.10% 4208 35 580.00 3170.75 345.00 8.304.10 12,62505 1.750 35 9,263 85 1,03500 21,64.25 5.3% 0.7% 3.9% 0.4% 10.47% 0.5% 0.11 32 2654.70 1.155.0 32% 02% 0.1% 00% 25% 10% 08% 3.1% 12% 8,084.10 3.86620 32250 1.000 55 7,024.50 2.62072 3.236.50 5.62.50 3,735.16 O 13% Operating Expenses Management salaries Employee and promo discounts Supplies & small wares Chemical cost-Gen Cleaning & Dishwasher Bank & Credit card charges Interest on long term loan Professional fees Advertising Telephone & cable Office supplies Travel & entertainment Miscellaneous Municiple taxes Equipment rental Repairs & maintenance Depreciation Uniforms Delivery expense Club promotion Total operating expenses Net Income loss) 2.654.70 1,205.10 4525 487. 2.45.40 800.2 1.275.00 2,262.3 1,237.5 233.11 10.10 700.12 1,624.00 131.00 1,300.00 2.262.00 420.00 1,633.00 300.00 2131.56 2.7% 1.5% 0.3% 0.0% 2.1% 17% 04% 03% 2.86470 1,50570 14875 SC045 235020 BCO DO 1001.50 1650 DO 1242.00 23445 250 25 450.00 162400 13100 148.00 3.010.00 13500 1 A7000 325.00 19,851.00 32% 2.1% 02% 08% 32% 12% 14% 2.3% 1.7% 0.3% 0.3% 0.8% 22% 02% 02 42% 02% 20% 50.00 2217.50 870.20 63.00 1.540.00 1255.00 321.00 220.10 60.00 1.624.00 131.00 20.00 2870.00 120.00 1.435.00 315.00 193 18.00 34% 1.0% 0.1% 0.7% 3.0% 1.1% 14% 2.3% 1.0% 0.3% 0.2% 0.8% 2.1% 0.2% 0.7% 3.4% 0.3% 1.9% 04% 25.9% 03% 15% 02% 10% 275 0.5% 20% 0.4% 25.5% 22% 02% 0.4% 40% 02% 20% 4045 1.800.12 4,87200 33.00 1.764.00 8.17200 675.00 4,538.00 1,000.00 60,486.95 26.2% 26.9% $ 2,819.46 3.4% $ 3406. 47% 5 7,4095 13.606.14 57% Using the provided Income Statement worksheet and create a one-page analysis of what the data presented shows. Address the following questions in your analysis: What data is provided? What does the data show us? Can you identify any trends? Is there any data that could have been added to make a stronger report? Do you have any recommendations to the business owners? YtoD % of Sales Income statement SAMPLE ONLY Food & Bar sales Food sales Barsales Total F&B sales 94% 78.535.10 450.00 BUNU 68.565.05 3.755.0 $ 78,5400 $ 480 40 BIFURS $ 224.040 24 $ 13.241 0 100% Cost of Food only March05 January-05 Consumption January 05 February-06 February-05 March-05 Consumption Consumption Yto D Yton Coot 3 Total sales 8.9896 221.10 10.106.25 28115 12 19150 720ST 1919.10 TANT FOGO Cregory Groceries Fruit Vegetable Dary Bakery MESSE LT10 RTO Food h Hoces (FIP) 6.08 30 241570 1.56756 19939 26 URUST 3367 235551 UUS 22.12% 23 083 2483 77.54695 34.01% Food Cost before ad stments Retete crYearly the months 29 883.77 660.67 0.90 66667 097% 0.00% Food Cont Ater Rebase Minus Credits Adjustments 33.72% 29 217.11 230.12 22.418. 2.150.2 23.516.42 2.10.12 2,000.00 75,516 95 6.770.30 3125% 286 3,03% 3.02% 3.10 29.50 Total food cost 26,820.00 33.90 20.228.30 20726.30 28.39% 68.779.59 28.50% 28.90 35.0 2000 Bar cost (Beer Paper & single service items CUGSTRICSSR T600 2893.50 30. 2563551 ZAVRU 310333 $ 52.415.01 120.25 53,668.26 628% $ 48 DS5 14 1.5% 174.D 643% $ 49.840.64 67% $ 12,82524 18% $ 4.452.00 69.7% $ 160,724 657% 1.9% 675% $ Gross Margin on sales - (Alter COGS) Lotorevenue Total Income Wages Benefits @ 15.5% of wages Totd labour costs o Prime CECOGS LICOR 66.5% $ 55315.00 24% 1.456 25 68.9% $ 5677134 1758 17.100.00 278% 2.650.00 2077 19750,00 1724.00 2688.00 19.037.00 3.22% 23.95 150 12.50 2325.00 17 337.90 3.17% S 23.66% 7.663.00 5.624.90 20.8% 3.2% 24.0% 40362.51 SURSUZ2135 BUYERS 550 58% Occupancy costs Rent or Mortgage Utilities Propane Insurance Total Ocalpancy cost 420835 58025 3.237.00 34500 8340.00 5,04% 0.68% 3.88% 4208.35 620.10 285.10 345.00 58% OS 35% 420835 580.00 3170.75 12.02505 1,750.35 28385 1,03500 24.64.25 0.8% 44% 0.5% 0.11 5.3% 0.7% 3.9% 0.4% 10.40% 34500 11.10% 8304.10 2654.70 1.205.10 45.25 32% 1.4% 0.15 2654.70 1.150 32 16% 32% 2.1% 02% 08% 550.60 2217 50 870.20 295 10% 1.55 27% 32% 3.15 12% 135 2.15 12% 23 Operating Expenses Management salaries Employee and promo discounts Supplies & smalwares Chemical cost-Gen Cleaning & Dishwasher Bank & Credit card charges Interest on long term loan Professional fees Advertising Telephone & cable Office supplies Travel & entertainment Misoolaneous Municiple taxes Equipment rental Repairs & maintenance Depreciation Uniforms Delivery expense Club promotion Total operating expenses 1.540.00 125600 321.00 2200 243.40 860.2 1.275.00 2.262.5 1.237.5 233.11 10.10 700.12 1.624.00 131.00 1.300.00 2252.00 420.00 1.633.00 300.00 2137.96 1.7% 0.3% 0.3% 2.86470 1.50570 14875 560.45 2350 20 850.00 1.00150 1650.00 120.00 23445 250 25 450.00 1.824.00 13100 148.00 3.010.00 135.00 1.470.00 325.00 19.051.00 0.3% 00% 08% 1.9% 02% 18% 27% 0.5% 20% 0.4% 25.5% 8.084.10 3.800 20 322.50 1.628.55 7.624.30 2.620.72 3.239.50 5.42.50 3.735.10 788.56 8045 1.800.12 4,872.00 33.00 1.784.00 8.172.00 675.00 4.38.00 1.000.00 60.486.95 34% 1.6% 0.1% 0.7% 3.0% 1.1% 14% 2.3% 1.6% 0.3% 0.2% 0.8% 2.1% 0.2% 0.7% 3.4% 0.3% 1.9% 0.4% 25.5% 225 02% 13100 23.00 2.870.00 120.00 1.435.00 315.00 19318.00 22% 02% 02% 42% 02% 2.0% 02 20% 26.26 26.9% Net income foss) $ 2819.46 3.4% 5 3.40.BE 7.405 SS 5.1% 13.636.14 57% Yton %d Sales Income statement SAMPLE ONLY Food & Bar sales Food sales Barsales Total F&B sales 78 535.10 $ 68.505.05 3765. $ 78,540 D $ 4850 40 SISUS $ 224,040 24 $ 13,24150 0% 100% BU Cost of Food only Yto D January 05 Consumption March 05 % Yton January 05 February 05 Consumption Cost Total sales 20112033 February 05 March Consumption 6,734.55 1919.10 TUESIS 7220201 GBBT 2009 170930 U. 07551 20170 1,557501 1572 6980 Food Cinegory Groceries Huit Vegetabb Dairy ry Health PUIGPUP Food in House (FIP) Food Costborstens beberal - Yartyretube/ 12 months Food Cost - Ate Rebab accural Minus Credits Austers 000 37.86% 29883.77 23.083.00 33 67% 24,5830 32.125 77,54695 34.678 0.84% 600.67 097 0875 2.000.00 0.8% 26 217.11 2,390.12 37.01% 3.00% 2249. 2.160.12 32 3.18% 666 67 235 18 42 2.160.12 3125% 288 75,546 6,77036 33.770 3. Total food cost 26.820.00 20.220.30 20.50 21726.30 28.39% 68.779.59 23.9 28 99 35. Bar cost (Beer & Liquor Paper & single sevke Toms COUSIGRICOSTI GOUSSE 2000 HAN 23.30 31 23551 125 325 3215 71 3154909 Gross Margin on sales. After COGS) Lotorevenue Total income 2415.01 120.25 50.665.26 628% $ 48065.14 1.5% 1.745.50 64.3% S 49.840.04 68.5% $ 55,31509 24% 1458 25 68.9% $ 56,77134 678% $ 155,82524 18% 5 4.452.00 69.7% $ 160,2724 65.7% 1.9% 675 Wages Benefits 15.5% of wages Tota labour costs 1724.00 2.688.00 19.07.00 20.00% 3.22% 15.012.50 2.325.00 17337.00 1758% 2.78% 20.77% 17,100.00 2.65000 19.750.00 3.17% 5 7.663.00 5.04.00 20.8% 3.2% 24.0% IGE PAT CORECOGS ZILABOUR) 252185 USORES 20 5.8% 08% Occupancy costs Rent or Mortgage Propane Insurance Total Ocupancy cost 420835 50 25 3.237.00 346.00 8340.60 5.04% 0.00% 3.88% 0.41% 4208.35 620.10 28.10 345.00 8.020.58 58% 09% 39% 0.5% 11.10% 4208 35 580.00 3170.75 345.00 8.304.10 12,62505 1.750 35 9,263 85 1,03500 21,64.25 5.3% 0.7% 3.9% 0.4% 10.47% 0.5% 0.11 32 2654.70 1.155.0 32% 02% 0.1% 00% 25% 10% 08% 3.1% 12% 8,084.10 3.86620 32250 1.000 55 7,024.50 2.62072 3.236.50 5.62.50 3,735.16 O 13% Operating Expenses Management salaries Employee and promo discounts Supplies & small wares Chemical cost-Gen Cleaning & Dishwasher Bank & Credit card charges Interest on long term loan Professional fees Advertising Telephone & cable Office supplies Travel & entertainment Miscellaneous Municiple taxes Equipment rental Repairs & maintenance Depreciation Uniforms Delivery expense Club promotion Total operating expenses Net Income loss) 2.654.70 1,205.10 4525 487. 2.45.40 800.2 1.275.00 2,262.3 1,237.5 233.11 10.10 700.12 1,624.00 131.00 1,300.00 2.262.00 420.00 1,633.00 300.00 2131.56 2.7% 1.5% 0.3% 0.0% 2.1% 17% 04% 03% 2.86470 1,50570 14875 SC045 235020 BCO DO 1001.50 1650 DO 1242.00 23445 250 25 450.00 162400 13100 148.00 3.010.00 13500 1 A7000 325.00 19,851.00 32% 2.1% 02% 08% 32% 12% 14% 2.3% 1.7% 0.3% 0.3% 0.8% 22% 02% 02 42% 02% 20% 50.00 2217.50 870.20 63.00 1.540.00 1255.00 321.00 220.10 60.00 1.624.00 131.00 20.00 2870.00 120.00 1.435.00 315.00 193 18.00 34% 1.0% 0.1% 0.7% 3.0% 1.1% 14% 2.3% 1.0% 0.3% 0.2% 0.8% 2.1% 0.2% 0.7% 3.4% 0.3% 1.9% 04% 25.9% 03% 15% 02% 10% 275 0.5% 20% 0.4% 25.5% 22% 02% 0.4% 40% 02% 20% 4045 1.800.12 4,87200 33.00 1.764.00 8.17200 675.00 4,538.00 1,000.00 60,486.95 26.2% 26.9% $ 2,819.46 3.4% $ 3406. 47% 5 7,4095 13.606.14 57%
Step by Step Solution
There are 3 Steps involved in it

Get step-by-step solutions from verified subject matter experts