

Question: Using the scatterplot shown below, which of the following matches the strength of association among the flipper length and bill length, assuming the relationship is
Using the scatterplot shown below, which of the following matches the strength of association among the flipper length and bill length, assuming the relationship is linear?
Options:
Weak Association (correlation between 0 and 0.4 in absolute value).
Strong Association (correlation between 0.5 and 1.0 in absolute value).
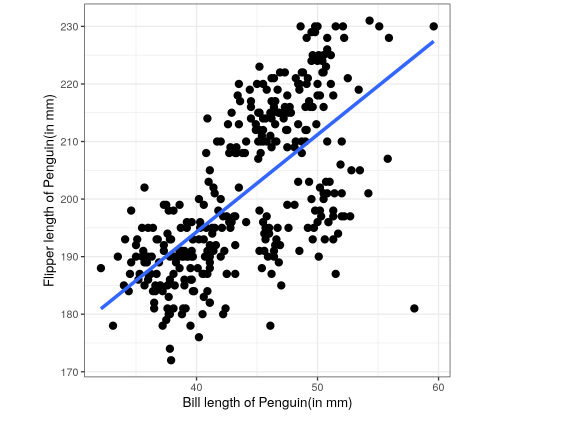
230 - 220 - 210 - Flipper length of Penguin(in mm) 200 - 190 - 180 - 170 - 40 50 60 Bill length of Penguin(in mm)
Step by Step Solution
There are 3 Steps involved in it
1 Expert Approved Answer
Step: 1 Unlock

Question Has Been Solved by an Expert!
Get step-by-step solutions from verified subject matter experts
Step: 2 Unlock
Step: 3 Unlock