

Question: Using the table attached below, plot the opportunity set of risky assets in Excel. Then vary the correlation between stocks and bonds from + 1
Using the table attached below, plot the opportunity set of risky assets in Excel.
Then vary the correlation between stocks and bonds from + 1 to -1 and describe the changes in shape of the efficient frontier as you do so.
Upload the Excel file that contains the table & graph.
Also include in Excel file a description of the efficient frontier's shape as you vary the correlation.

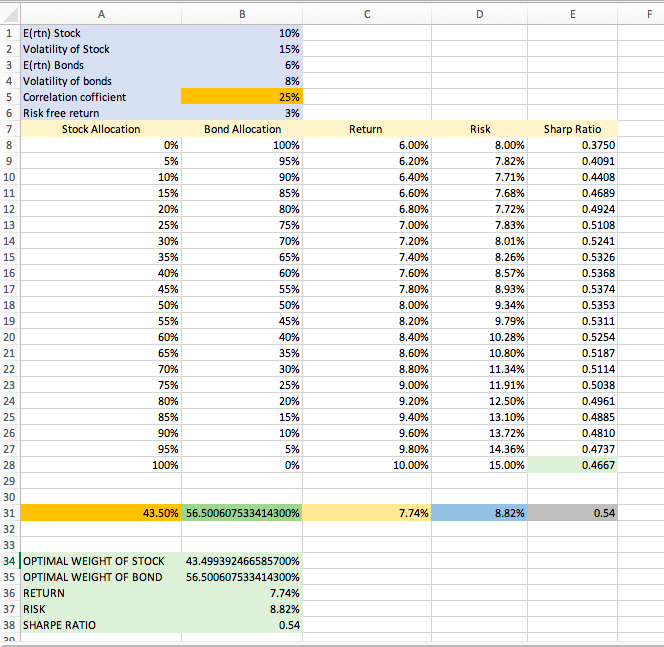
A B C D E F 1 E( rtn) Stock 10%% 2 Volatility of Stock 15% 3 E(rtn) Bonds 6% 4 Volatility of bonds 8% 5 Correlation cofficient 25% 6 Risk free return 3% Stock Allocation Bond Allocation Return Risk Sharp Ratio 0% 100% 6.00% 8.00% 0.3750 9 5% 95% 6.20% 7.82% 0.4091 10 10% 90% 6.40% 7.71% 0.4408 11 15% 85% 6.60% 7.68% 0.4689 12 20%% 80% 6.80% 7.72% 0.4924 13 25% 75% 7.00% 7.83% 0.5108 14 30% 70% 7.20% 8.01% 0.5241 15 35% 65% 7.40% 8.26% 0.5326 16 40% 60% 7.60% 8.57% 0.5368 45% 55% 7.80% 8.93% 0.5374 50% 50% 8.00% 9.34% 0.5353 55%% 45% 8.20% 9.79% 0.5311 60% 40% 8.40% 10.28% 0.5254 65% 35% 8.60% 10.80% 0.5187 70%% 30%% 8.80% 11.34% 0.5114 75% 25% 9.00% 11.91% 0.5038 80% 20% 9.20% 12.50% 0.4961 85% 15% 9.40% 13.10% 0.4885 90% 10% 9.60% 13.72% 0.4810 95%% 5% 9.80% 14.36% 0.4737 28 100% 0% 10.00% 15.00% 0.4667 30 31 43.50%% 56.500607533414300% 7.74% 8.82% 0.54 32 33 34 OPTIMAL WEIGHT OF STOCK 43.499392466585700%% 35 OPTIMAL WEIGHT OF BOND 56.500607533414300% 36 RETURN 7.74% 37 RISK 8.82% 38 SHARPE RATIO 0.54 an
Step by Step Solution
There are 3 Steps involved in it

Get step-by-step solutions from verified subject matter experts