Question: using the table below, and given an average of 1200 units produced a day with a standard deviation of 10, what is the approximate confidence

using the table below, and given an average of 1200 units produced a day with a standard deviation of 10, what is the approximate confidence level that you will be able to produce a minimum of 1213 units? %using the table below, and given an average of

AREAS OF THE CUMULATIVE STANDARD NORMAL DISTRIBUTION G2) An entry in the table is the proportion under the curve cumulated from the negative tail. Z G(2) Z G(2) z -4.00 0.00003 -1.30 0.09680 1.40 -3.95 0.00004 0.91924 -1.25 0.10565 1.45 -3.90 0.00005 0.92647 - 1.20 0.11507 1.50 -3.85 0.00006 0.933 19 -1.15 0.12507 1.55 0.93943 -3.80 0.00007 -1.10 0.13567 1.60 -3.75 0.00009 0.94520 -1.05 0.14686 1.55 -3.70 0.95053 0.00011 -1.00 0.15866 1.70 0.95543 -3.65 0.00013 -0.95 0.17106 1.75 0.95994 -3.60 0.00016 -0.90 0.18406 1.80 -3.55 0.00019 0.96407 -0.85 0.19766 1.85 0.96784 -3.50 0.00023 -0.80 0.21186 1.90 -3.45 0.97128 0.00028 -0.75 0.22663 1.95 0.97441 -3.40 0.00034 -0.70 0.24196 2.00 -3.35 0.97725 0.00040 -0.65 0.25785 2.05 -3.30 0.97982 0.00048 -0.60 0.27425 2.10 -3.25 0.00058 0.98214 -0.55 0.29116 2.15 -3.20 0.98422 0.00069 -0.50 0.30854 2 20 0.98610 -3.15 0.00082 - 45 0.32636 2.25 -3.10 0.98778 0.00097 -0.40 0.34458 2.30 0.98928 -3.05 0.00114 -0.35 0.36317 2.35 0.99061 -3.00 0.00135 -0.30 0.38209 2.40 -2.95 0.00159 0.99 180 -0.25 0.40129 2.45 099286 -2.90 0.00187 020 0.42074 2.50 -2.85 0.00219 0.99379 -0.15 0.44038 2.55 -2.80 0.00256 0.99461 -0.10 0.46017 2.60 -2.75 0.00298 0.99534 -0.05 0.48006 2.65 0.99598 -2.70 0.00347 0.00 0.50000 2.70 0.99653 -265 0.00402 0.05 0.51994 2.75 -2.60 0.00466 0.99702 0.10 0.53983 2.80 -2.55 0.00539 0.99744 0.15 0.55962 2.85 0.99781 -2.50 0.00621 0.20 0.57926 2.90 -2.45 0.00714 0.99813 0.25 0.59871 2.95 -2.40 0.00820 0.99841 0.30 0.61791 3.00 0.99865 -2.35 0.00939 0.35 0.63683 3.05 0.99886 -2.30 0.01072 0.40 0.65542 -2.25 3.10 0.99903 0.01222 0.45 0.67364 3.15 0.99918 -220 0.01390 0.50 0.69146 3.20 0.99931 -2.15 0.01578 0.55 0.70884 3.25 -2.10 0.01786 0.99942 0.60 0.72575 3.30 -205 0.02018 0.99952 0.65 0.74215 -200 3.35 0.02275 0.99960 0.70 0.75804 3,40 0.99966 -1.95 0.02559 0.75 0.77337 3,45 0.99972 -1.90 0.02872 0.80 0.78814 3.50 -1.85 0.99977 0.03216 0.85 0.80234 3.55 -1.80 0.03593 0.99981 0.90 0.8 1594 3.60 -1.75 0.04006 0.99984 0.95 0.82894 3.65 0.99987 -1.70 0.04457 1.00 0.84134 3.70 -1.65 0.04947 0.99989 1.05 0.85314 3.75 0.99991 -1.60 0.05480 1.10 0.86433 3.80 0.99993 -1.55 0.06057 1.15 0.87493 3.85 -1.50 0.99994 0.06681 1.20 0.88493 3.90 0.99995 -1.45 0.07353 1.25 0.89435 3.95 0.99996 -1.40 0.08076 1.30 0.90320 4.00 0.99997 -1.35 0.08851 1.35 0.91149 Using Microsoft Excel these probabilities are generated with the NORM.S. DISTI, TRUE) function

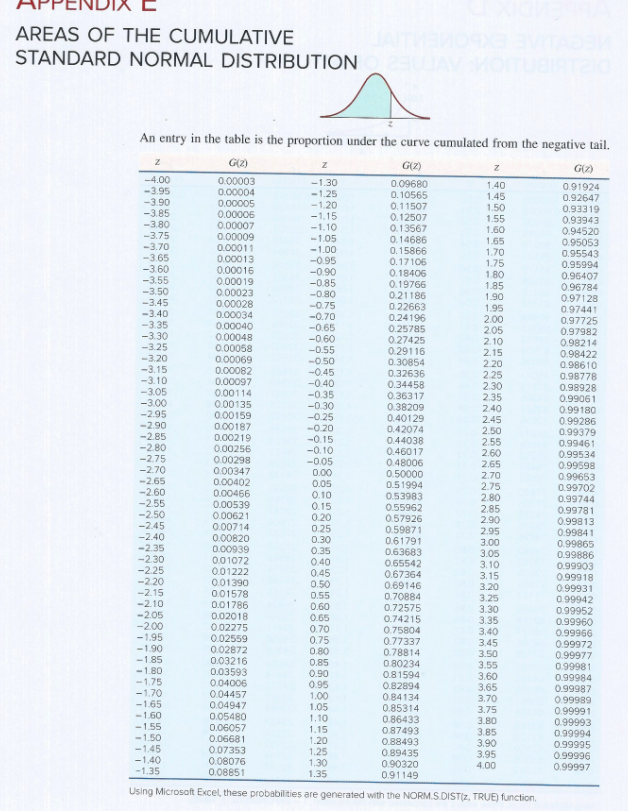
Step by Step Solution

There are 3 Steps involved in it

1 Expert Approved Answer
Step: 1 Unlock blur-text-image
Question Has Been Solved by an Expert!

Get step-by-step solutions from verified subject matter experts

Step: 2 Unlock
Step: 3 Unlock

Students Have Also Explored These Related General Management Questions!