

Question: Using the table below describe the WACC drivers that explain the difference between the WACC of EBS and its comparables Capital Structure Components WACC Cost
Using the table below describe the WACC drivers that explain the difference between the WACC of EBS and its comparables
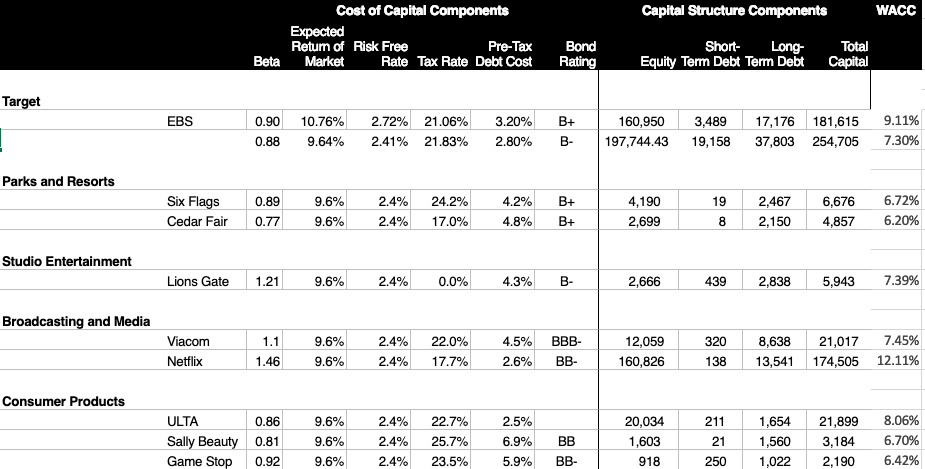
Capital Structure Components WACC Cost of Capital Components Expected Return of Risk Free Pre-Tax Market Rate Tax Rate Debt Cost Beta Bond Rating Short- Long- Equity Term Debt Term Debt Total Capital Target EBS 0.90 0.88 10.76% 9.64% 2.72% 2.41% 21.06% 21.83% 3.20% 2.80% B+ B- 160,950 197,744.43 3,489 19,158 17,176 37,803 181,615 254,705 9.11% 7.30% Parks and Resorts Six Flags Cedar Fair 0.89 0.77 9.6% 9.6% 2.4% 2.4% 24.2% 17.0% 4.2% 4.8% B+ B+ 4,190 2,699 192,467 8 2,150 6,676 4.857 6.72% 6.20% I Studio Entertainment Lions Gate 1.219.6% 2.4% 0.0% 4.3% B- 2,666 439 2,8385,943 7.39% Broadcasting and Media Viacom Netflix 1.1 1.46 9.6% 9.6% 2.4% 2.4% 22.0% 17.7% 4.5% 2.6% BBB- BB- 12,059 160,826 160,826 320 138 8,638 13,541 21,017 174,505 7.45% 12.11% Consumer Products ULTA Sally Beauty Game Stop 0.86 0.81 0.92 9.6% 9.6% 9.6% 2.4% 2.4% 2.4% 22.7% 25.7% 23.5% 2.5% 6.9% 5.9% BB BB- 20,034 1,603 918 211 21 250 1,654 1,560 1,022 21,899 3,184 2,190 8.06% 6.70% 6.42%
Step by Step Solution
There are 3 Steps involved in it

Get step-by-step solutions from verified subject matter experts