

Question: Using the table below, interpret all key regression results. SUMMARY OUTPUT Regression Statistics Multiple R 0.86977145 R Square 0.75650237 Adjusted R Square 0.75070481 Standard Error
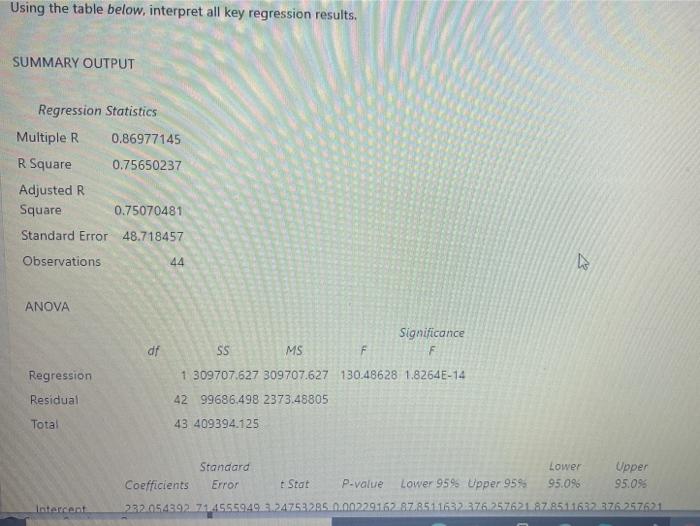
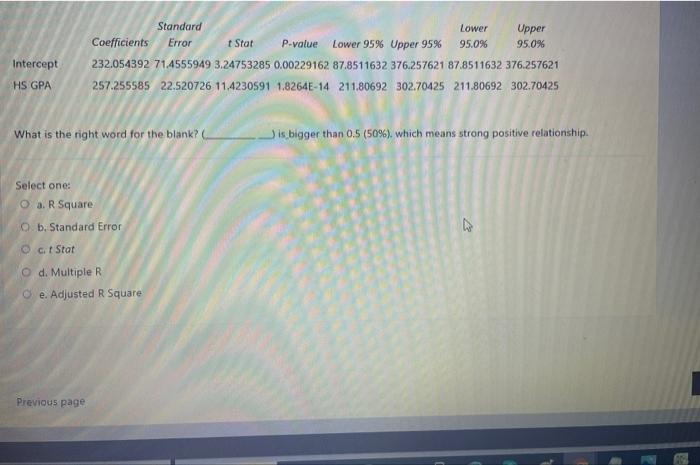
Using the table below, interpret all key regression results. SUMMARY OUTPUT Regression Statistics Multiple R 0.86977145 R Square 0.75650237 Adjusted R Square 0.75070481 Standard Error 48.718457 Observations 44 us ANOVA df Regression Residual Total Significance SS MS F F 1 309707.627 309707.627 130.48628 1.8264E-14 42 99686.498 2373.48805 43 409394.125 Standard Lower Upper Coefficients Error + Stat P-value Lower 95% Upper 95% 95.096 95.09 232.05499276465940324752 2050.0022916287.851.16323776.257621 87956166276257621 intercept Intercept Standard Lower Upper Coefficients Error t Star P-value Lower 95% Upper 95% 95.0% 95.0% 232.054392 71.4555949 3.24753285 0.00229162 87.8511632 376.257621 87.8511632 376.257621 257.255585 22.520726 11.4230591 1.8264E-14 211.80692 302.70425 211.80692 302.70425 HS GPA What is the right word for the blank? Jis bigger than 0.5 (50%), which means strong positive relationship. Select one: a. R Square O b. Standard Error D. Oct Star O d. Multiple R e. Adjusted R Square Previous page
Step by Step Solution
There are 3 Steps involved in it

Get step-by-step solutions from verified subject matter experts