

Question: Using the table below, reference the period from 1973 through 1978 only. U.S. Long-Term Government Treasury Consumer Price Bills Bonds Index Year 1957 1958
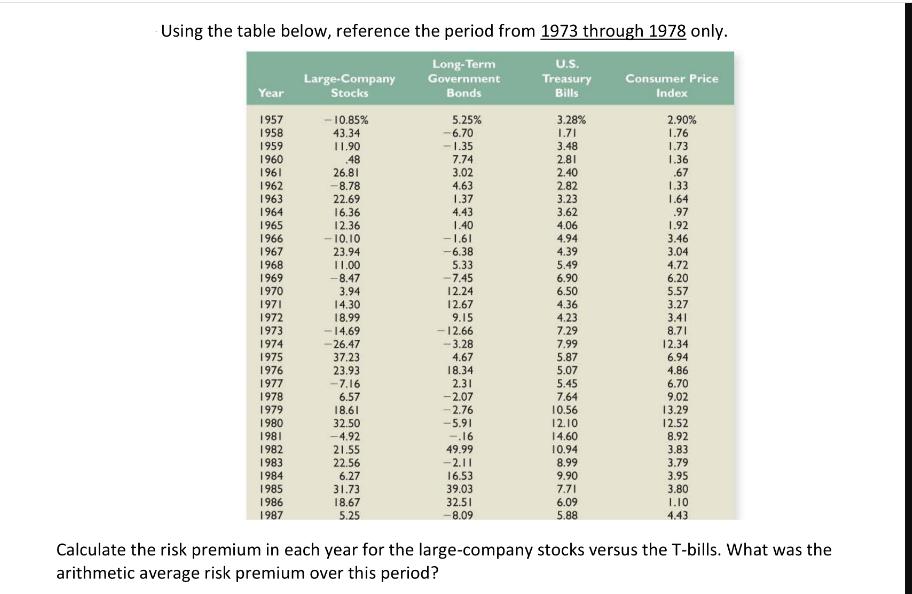
Using the table below, reference the period from 1973 through 1978 only. U.S. Long-Term Government Treasury Consumer Price Bills Bonds Index Year 1957 1958 1959 1960 1961 1962 1963 1964 1965 1966 1967 1968 1969 1970 1971 1972 1973 1974 1975 1976 1977 1978 1979 1980 1981 1982 1983 1984 1985 1986 1987 Large-Company Stocks -10.85% 43.34 11.90 48 26.81 -8.78 22.69 16.36 12.36 -10.10 23.94 11.00 -8.47 3.94 14.30 18.99 - 14.69 -26.47 37.23 23.93 -7.16 6.57 18.61 32.50 -4.92 21.55 22.56 6.27 31.73 18.67 5.25 5.25% -6.70 - 1.35 7.74 3.02 4.63 1.37 4.43 1.40 -1.61 -6.38 5.33 -7.45 12.24 12.67 9.15 - 12.66 -3.28 4.67 18.34 2.31 -2.07 -2.76 -5.91 -.16 49.99 -2.11 16.53 39.03 32.51 -8.09 3.28% 1.71 3.48 2.81 2.40 2.82 3.23 3.62 4.06 4.94 4.39 5.49 6.90 6.50 4.36 4.23 7.29 7.99 5.87 5.07 5.45 7.64 10.56 12.10 14.60 10.94 8.99 9.90 7.71 6.09 5.88 2.90% 1.76 1.73 1.36 .67 1.33 1.64 .97 1.92 3.46 3.04 4.72 6.20 5.57 3.27 3.41 8.71 12.34 6.94 4.86 6.70 9.02 13.29 12.52 8.92 3.83 3.79 3.95 3.80 1.10 4.43 Calculate the risk premium in each year for the large-company stocks versus the T-bills. What was the arithmetic average risk premium over this period?
Step by Step Solution
There are 3 Steps involved in it
To calculate the risk premium for largecompany stocks versus Tbills we need to subtract th... View full answer

Get step-by-step solutions from verified subject matter experts