

Question: Using the table format and the data provided, complete the yellow boxes and give a brief description of the table.SectionBSP 1-4BSP 1-5BSP 1-4BSP 1-5BSP 1-4BSP
Using the table format and the data provided, complete the yellow boxes and give a brief description of the table.SectionBSP 1-4BSP 1-5BSP 1-4BSP 1-5BSP 1-4BSP 1-4BSP 1-4BSP 1-5BSP 1-4BSP 1-4BSP 1-4BSP 1-4BSP 1-5BSP 1-5BSP 1-4Age181919202019201918221920202019201919Sexmalefemalemalefemalefemalefemalefemalefemalefemalemalefemalemalefemalemalemalefemalefemalemalefemalemale
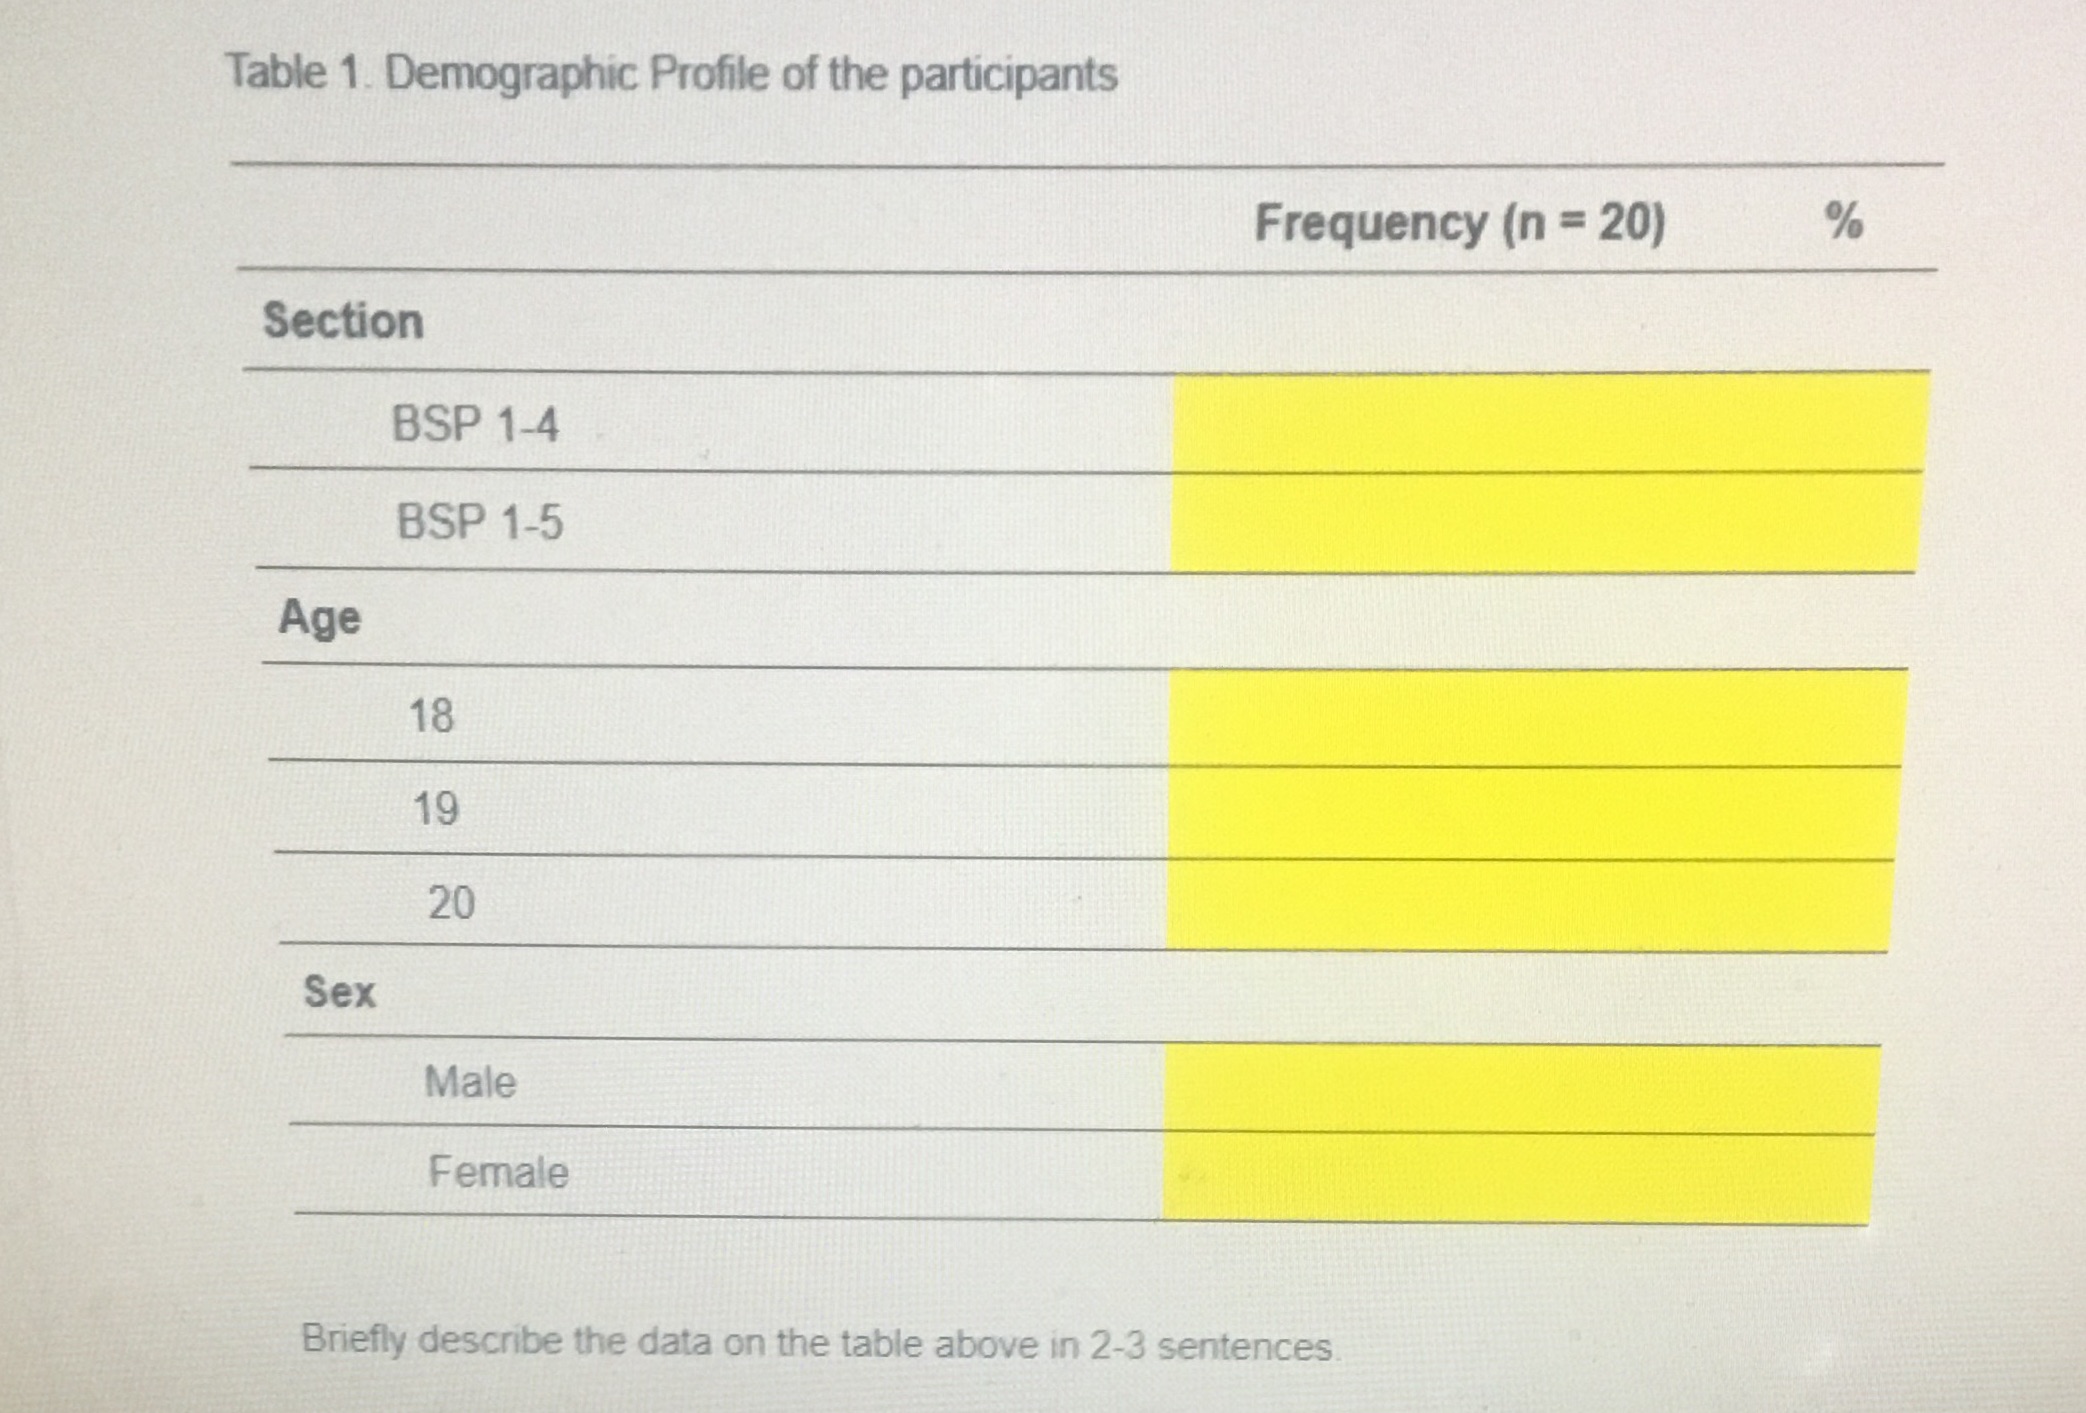
Table 1. Demographic Profile of the participants Frequency (n = 20) % Section BSP 1-4 BSP 1-5 Age 18 19 20 Sex Male Female Briefly describe the data on the table above in 2-3 sentences
Step by Step Solution
There are 3 Steps involved in it
1 Expert Approved Answer
Step: 1 Unlock

Question Has Been Solved by an Expert!
Get step-by-step solutions from verified subject matter experts
Step: 2 Unlock
Step: 3 Unlock