

Question: Using the tears built-in data set, plot the densities of the mpg of the different kinds of cyl on the same plot, with appropriate
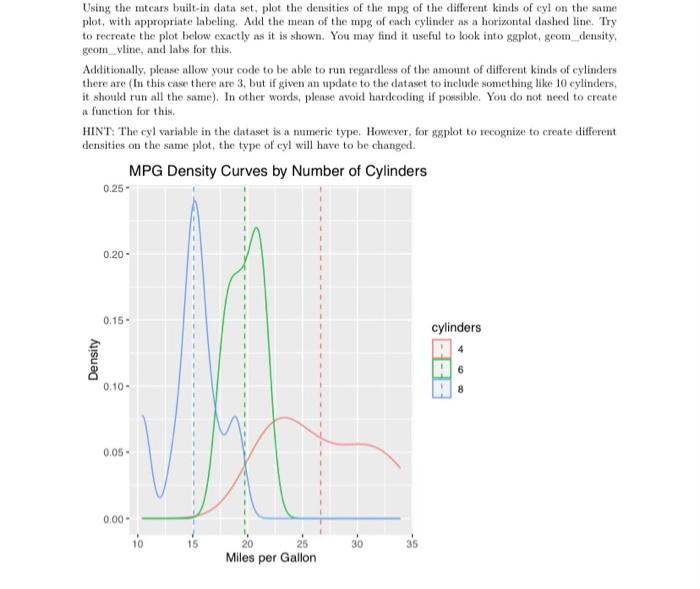
Using the tears built-in data set, plot the densities of the mpg of the different kinds of cyl on the same plot, with appropriate labeling. Add the mean of the mpg of each cylinder as a horizontal dashed line. Try to recreate the plot below exactly as it is shown. You may find it useful to look into ggplot, geom_density. geom vline, and labs for this. Additionally, please allow your code to be able to run regardless of the amount of different kinds of cylinders there are (In this case there are 3, but if given an update to the dataset to include something like 10 cylinders, it should run all the same). In other words, please avoid hardcoding if possible. You do not need to create a function for this. HINT: The cyl variable in the dataset is a numeric type. However, for ggplot to recognize to create different densities on the same plot, the type of cyl will have to be changed. MPG Density Curves by Number of Cylinders Density 0.25- 0.20- 0.15- 0.10- 0.05- 0.00- 25 Miles per Gallon 30 cylinders
Step by Step Solution
3.35 Rating (155 Votes )
There are 3 Steps involved in it
Expl... View full answer

Get step-by-step solutions from verified subject matter experts