

Question: Using the temperature and Gf values listed in Table 2.1 (Table 2.1 is posted on the course webpage under the Handouts link), generate a table
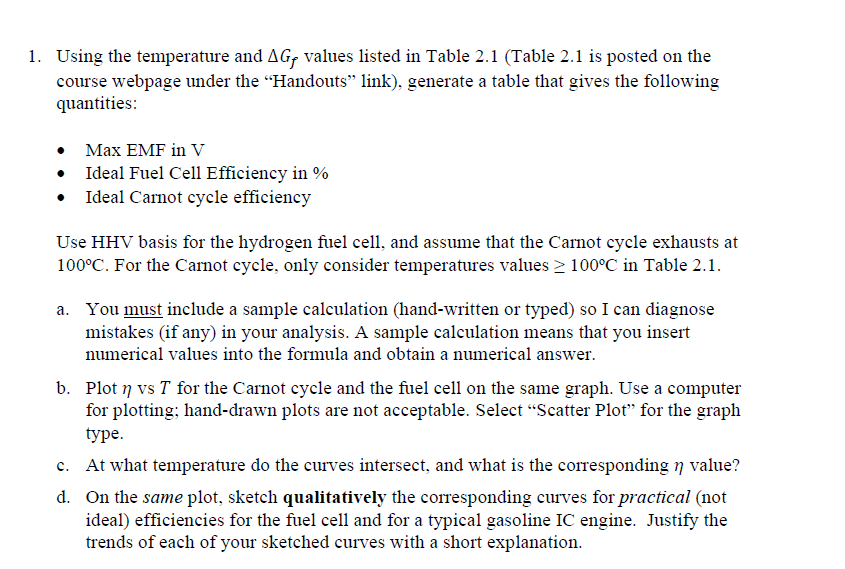
Using the temperature and Gf values listed in Table 2.1 (Table 2.1 is posted on the course webpage under the "Handouts" link), generate a table that gives the following quantities: - Max EMF in V - Ideal Fuel Cell Efficiency in \% - Ideal Carnot cycle efficiency Use HHV basis for the hydrogen fuel cell, and assume that the Carnot cycle exhausts at 100C. For the Carnot cycle, only consider temperatures values 100C in Table 2.1. a. You must include a sample calculation (hand-written or typed) so I can diagnose mistakes (if any) in your analysis. A sample calculation means that you insert numerical values into the formula and obtain a numerical answer. b. Plot vs T for the Carnot cycle and the fuel cell on the same graph. Use a computer for plotting; hand-drawn plots are not acceptable. Select "Scatter Plot" for the graph type. c. At what temperature do the curves intersect, and what is the corresponding value? d. On the same plot, sketch qualitatively the corresponding curves for practical (not ideal) efficiencies for the fuel cell and for a typical gasoline IC engine. Justify the trends of each of your sketched curves with a short explanation
Step by Step Solution
There are 3 Steps involved in it

Get step-by-step solutions from verified subject matter experts