

Question: Using the Value Line reports for Ford (NYSE-F) provided on the following page of this exam, what is the price range for F today in
Using the Value Line reports for Ford (NYSE-F) provided on the following page of this exam, what is the price range for F today in 2022 according to the DDM - non-constant growth model? To save time, no WHAT-IF scenario is required.
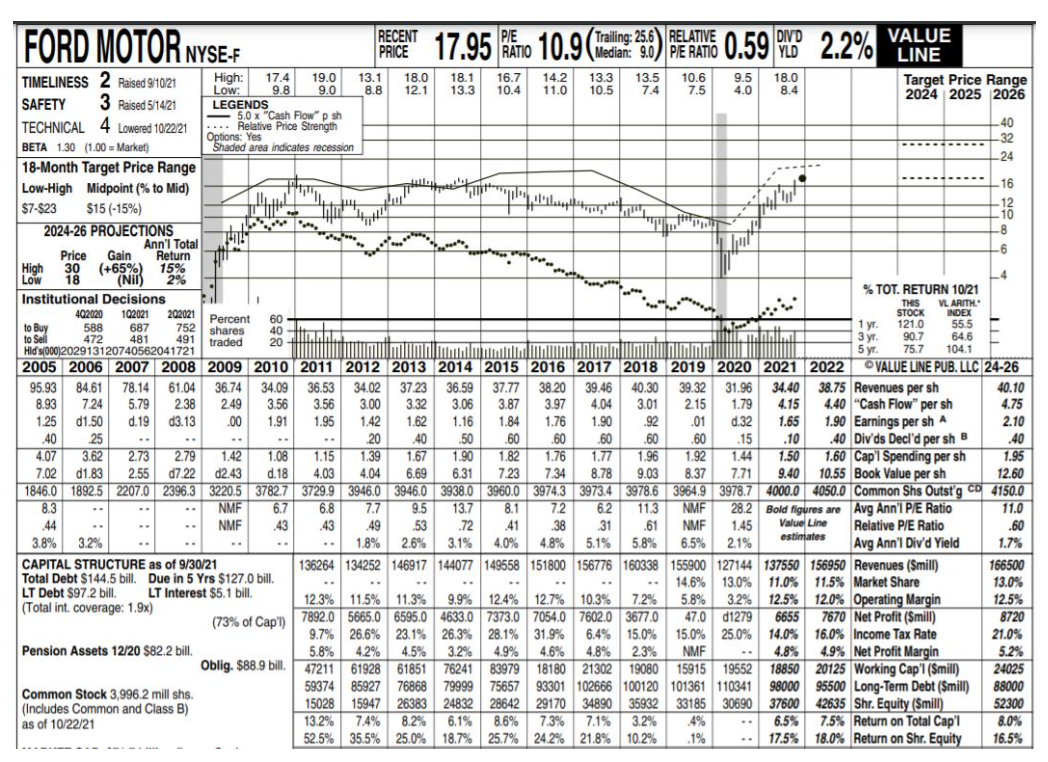
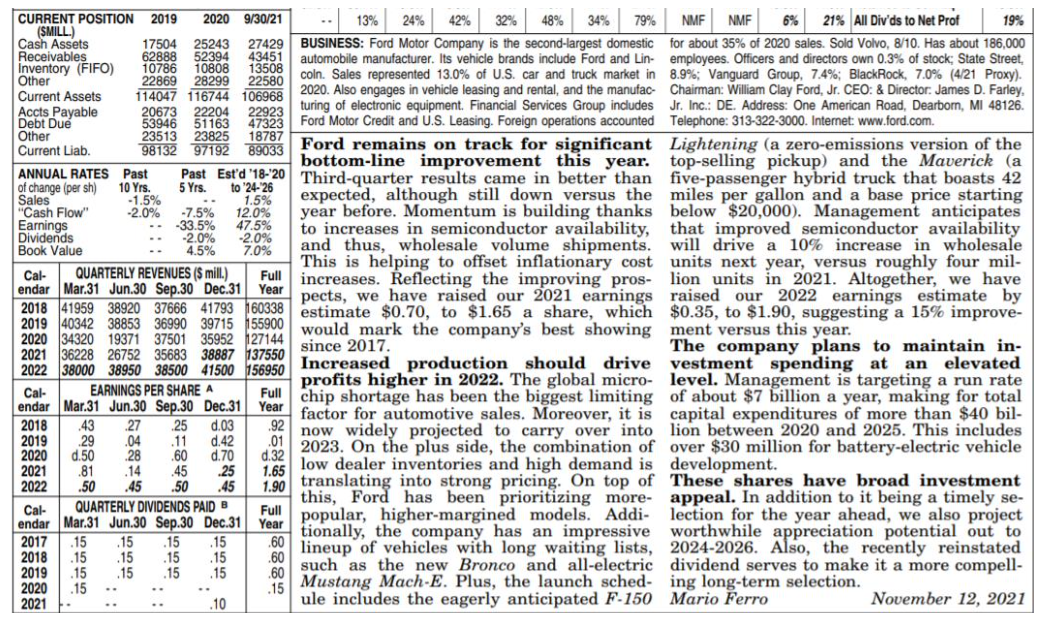
FORD MOTOR NYSE-F | PRICEAT 17.95 RATO 10.9 (Theding : :8) PEL AAYE 0.59 PD2.2% . Www . El 202021 Percent 40 20 Trailing25.6 RELATIVE DIVD VALUE F 9.0 YLD LINE TIMELINESS 2 Raised 9/10121 High: 17.4 19.0 13.1 18.0 18.1 16.7 14.2 13.3 13.5 10.6 9.5 18.0 Low 9.8 9.0 8.8 12.1 13.3 Target Price Range 10.4 11.0 10.5 7.4 7.5 4.0 8.4 SAFETY 3 Raised 5/14/21 LEGENDS 2024 2025 2026 5.0 x "Cash Flow"psh TECHNICAL 4 Lowered 10/22/21 ... Relative Price Strength 40 Options: Yes BETA 1.30 (1.00 = Market) -32 Shaded area indicates recession 18-Month Target Price Range 24 Low-High Midpoint (% to Mid) 16 $7-$23 $15(-15%) TI 12 10 2024-26 PROJECTIONS hi! -8 Ann'l Total Price Gain Return -6 High 30 (+65%) 15% Low 18 (Nil) 2% -4 Institutional Decisions % TOT. RETURN 10/21 1 THIS 402020 VL ARITH 102021 60 STOCK INDEX to Buy 588 687 752 shares 1 . 1 yr. 121.0 55.5 to Sell 472 481 491 traded 3 yr. 90.7 64.6 Hid (000)202913120740562041721 5 yr. 75.7 104.1 2005 2006 2007 2008 2009 2010 2011 2012 2013 2014 2015 2016 2017 2018 2019 2020 2021 2022 VALUE LINE PUB. LLC 24-26 95.93 84.61 78.14 61.04 36.74 34.09 36.53 34.02 37.23 36.59 37.77 38.20 39.46 40.30 39.32 31.96 34.40 38.75 Revenues per sh 40.10 8.93 7.24 5.79 2.38 2.49 3.56 3.56 3.00 3.32 3.06 3.87 3.97 4.04 3.01 2.15 1.79 4.15 4.40 "Cash Flow" per sh 4.75 1.25 d1.50 d. 19 d3.13 .00 1.91 1.95 1.42 1.62 1.16 1.84 1.76 1.90 .92 .01 d.32 1.65 1.90 Earnings per shA 2.10 .40 25 20 .40 .50 .60 .60 .60 .60 .60 .15 .10 .40 Div'ds Decl'd per she .40 4.07 3.62 2.73 2.79 1.42 1.08 1.15 1.39 1.67 1.90 1.82 1.76 1.77 1.96 1.92 1.44 1.50 1.60 Cap' Spending per sh 1.95 7.02 01.83 2.55 d7.22 02.43 d. 18 4.03 4.04 6.69 6.31 7.23 7.34 8.78 9.03 8.37 7.71 9.40 10.55 Book Value per sh 12.60 1846.0 1892.5 2207.0 2396.3 3220.5 3782.7 3729.9 3946.0 3946.0 3938.0 3960.0 3974.3 3973.4 3978.6 3964.9 3978.7 4000.0 4050.0 Common Shs Outst'g CD 4150.0 8.3 NMF 6.7 6.8 7.7 9.5 13.7 8.1 7.2 6.2 NMF 28.2 Bold figures are Avg Ann'i P/E Ratio 11.0 .44 NMF .43 .43 .49 .53 .72 41 38 .31 .61 NMF 1.45 Value Line Relative P/E Ratio .60 3.8% 3.2% 1.8% 2.6% 3.1% 4.0% 4.8% 5.1% 5.8% 6.5% 2.1% estimates Avg Ann'l Div'd Yield 1.7% CAPITAL STRUCTURE as of 9/30/21 136264 134252 146917 144077 149558 151800 156776 160338 155900 127144 137550 156950 Revenues (Smill) 166500 Total Debt $144.5 bill. Due in 5 Yrs $127.0 bill. LT Debt $97.2 bill 14.6% 13.0% 11.0% 11.5% Market Share 13.0% LT Interest $5.1 bill. (Total int. coverage: 1.9x) 12.3% 11.5% 11.3% 9.9% 12.4% 12.7% 10.3% 7.2% 5.8% 3.2% 12.5% 12.0% Operating Margin 12.5% (73% of Capl) 7892.0 5665.0 6596.0 4633.0 7373.0 7054.0 7602,0 3677.0 47.0 d1279 6655 7670 Net Profit (Smill) 8720 9.7% 26.6% 23.1% 26.3% 28.1% 31.9% 6.4% 15.0% 15.0% 25.0% 14.0% 16.0% Income Tax Rate 21.0% Pension Assets 12/20 $82.2 bill. $ 5.8% 4.2% 4.5% 3.2% 4.9% 4.6% 4.8% 2.3% NMF 4.8% 4.9% Net Profit Margin 5.2% Oblig. $88.9 bill. 47211 61928 61851 76241 83979 18180 21302 19080 15915 19552 18850 20125 Working Cap'l (Smill) 24025 Common Stock 3,996.2 mill shs. 59374 85927 76868 79999 75657 93301 102666 100120101361 110341 98000 95500 Long-Term Debt (Smill) 88000 (Includes Common and Class B) 15028 15947 26383 24832 28642 29170 3489035932 33185 30690 37600 42635 Shr. Equity (Smill) 52300 as of 10/22/21 13.2% 7.4% 8.2% 6.1% 8.6% 7.3% 7.1% 3.2% .4% 6.5% 7.5% Return on Total Cap'l 8.0% 52.5% 35.5% 25.0% 18.7% 25.7% 24.2% 21.8% 10.2% .1% 17.5% 18.0% Return on Shr. Equity 16.5% 11.3 .. .. 32 48% 19% Other Earnings -33.5% CURRENT POSITION 2019 2020 9/30/21 13% 24% 42% 34% 79% NMF NMF (SMILL) 21% All Div'ds to Net Prof Cash Assets 17504 25243 27429 BUSINESS: Ford Motor Company is the second-largest domestic for about 35% of 2020 sales. Sold Volvo, 8/10. Has about 186,000 Receivables 62888 52394 43451 automobile manufacturer. Its vehicle brands include Ford and Lin- employees. Officers and directors own 0.3% of stock: State Street, Inventory (FIFO) 10786 10808 13508 2286928299 22580 coln. Sales represented 13.0% of U.S. car and truck market in 8.9%; Vanguard Group, 7.4%; BlackRock, 7.0% (4/21 Proxy). Current Assets 114047 116744 106968 2020. Also engages in vehicle leasing and rental, and the manufac- Chairman: William Clay Ford, Jr. CEO: & Director: James D. Farley, Accts Payable 20673 22204 22923 turing of electronic equipment. Financial Services Group includes Jr. Inc.: DE. Address: One American Road, Dearborn, MI 48126. Debt Due 53946 51163 47323 Ford Motor Credit and U.S. Leasing. Foreign operations accounted Telephone: 313-322-3000. Internet: www.ford.com. Other 23513 23825 18787 Current Liab. 98132 97192 89033 Ford remains on track for significant Lightening (a zero-emissions version of the bottom-line improvement this year. ANNUAL RATES Past top-selling pickup) and the Maverick (a of change (per sh) Past Estd 18:20 Third-quarter results came in better than five-passenger hybrid truck that boasts 42 10 Yrs. 5 to 24-26 Sales -1.5% 1.5% expected, although still down versus the miles per gallon and a base price starting "Cash Flow" -2.0% -7.5% 12.0% year before. Momentum is building thanks below $20,000). Management anticipates 47.5% Dividends to increases in semiconductor availability, -2.0% -2.0% that improved semiconductor availability Book Value 4.5% 7.0% and thus, wholesale volume shipments. will drive a 10% increase in wholesale Cal- QUARTERLY REVENUES (5 mill.) This is helping to offset inflationary cost units next year, versus roughly four mil- Full endar Mar 31 Jun 30 Sep.30 Dec.31 Year increases. Reflecting the improving pros- lion units in 2021. Altogether, we have pects, we have raised our 2021 earnings raised our 2022 earnings estimate by 2018 41959 38920 37666 41793 60338 estimate $0.70, to $1.65 a share, which $0.35, to $1.90, suggesting a 15% improve 2019 40342 38853 36990 39715 55900 would mark the company's best showing ment versus this year. 2020 34320 19371 37501 35952 27144 2021 36228 26752 35683 38887 137550 since 2017. The company plans to maintain in- 2022 38000 38950 3850041500 156950 Increased production_should drive vestment spending at an elevated profits higher in 2022. The global micro- level. Management is targeting a run rate Cal EARNINGS PER SHARE A Mar 31 Jun 30 Sep.30 Dec.31 Full chip shortage has been the biggest limiting of about $7 billion a year, making for total Year 2018 .43 25 factor for automotive sales. Moreover, it is capital expenditures of more than $40 bil- d.03 .92 2019 now widely projected to carry over into lion between 2020 and 2025. This includes .29 .04 d.42 .01 2020 d.50 d.70 2023. On the plus side, the combination of over $30 million for battery-electric vehicle 2021 .81 25 1.65 low dealer inventories and high demand is development. 2022 .50 .50 .45 1.90 translating into strong pricing. On top of These shares have broad investment this, Ford has been prioritizing more-appeal. In addition to it being a timely se- Cal- QUARTERLY DIVIDENDS PAID B endar Mar 31 Jun 30 Sep.30 Dec.31 Full popular, higher-margined models. Addi- lection for the year ahead, we also project Year 2017 .15 tionally, the company has an impressive worthwhile appreciation potential out to 15 15 .15 2018 .15 60 lineup of vehicles with long waiting lists, 2024-2026. Also, the recently reinstated .15 2019 .15 .15 .15 60 such as the new Bronco and all-electric dividend serves to make it a more compell- .15 2020 .15 .15 Mustang Mach-E. Plus, the launch sched- ing long-term selection. 2021 .10 ule includes the eagerly anticipated F-150 Mario Ferro November 12, 2021 endar 27 28 .14 .45 .11 .60 45 .15 15 FORD MOTOR NYSE-F | PRICEAT 17.95 RATO 10.9 (Theding : :8) PEL AAYE 0.59 PD2.2% . Www . El 202021 Percent 40 20 Trailing25.6 RELATIVE DIVD VALUE F 9.0 YLD LINE TIMELINESS 2 Raised 9/10121 High: 17.4 19.0 13.1 18.0 18.1 16.7 14.2 13.3 13.5 10.6 9.5 18.0 Low 9.8 9.0 8.8 12.1 13.3 Target Price Range 10.4 11.0 10.5 7.4 7.5 4.0 8.4 SAFETY 3 Raised 5/14/21 LEGENDS 2024 2025 2026 5.0 x "Cash Flow"psh TECHNICAL 4 Lowered 10/22/21 ... Relative Price Strength 40 Options: Yes BETA 1.30 (1.00 = Market) -32 Shaded area indicates recession 18-Month Target Price Range 24 Low-High Midpoint (% to Mid) 16 $7-$23 $15(-15%) TI 12 10 2024-26 PROJECTIONS hi! -8 Ann'l Total Price Gain Return -6 High 30 (+65%) 15% Low 18 (Nil) 2% -4 Institutional Decisions % TOT. RETURN 10/21 1 THIS 402020 VL ARITH 102021 60 STOCK INDEX to Buy 588 687 752 shares 1 . 1 yr. 121.0 55.5 to Sell 472 481 491 traded 3 yr. 90.7 64.6 Hid (000)202913120740562041721 5 yr. 75.7 104.1 2005 2006 2007 2008 2009 2010 2011 2012 2013 2014 2015 2016 2017 2018 2019 2020 2021 2022 VALUE LINE PUB. LLC 24-26 95.93 84.61 78.14 61.04 36.74 34.09 36.53 34.02 37.23 36.59 37.77 38.20 39.46 40.30 39.32 31.96 34.40 38.75 Revenues per sh 40.10 8.93 7.24 5.79 2.38 2.49 3.56 3.56 3.00 3.32 3.06 3.87 3.97 4.04 3.01 2.15 1.79 4.15 4.40 "Cash Flow" per sh 4.75 1.25 d1.50 d. 19 d3.13 .00 1.91 1.95 1.42 1.62 1.16 1.84 1.76 1.90 .92 .01 d.32 1.65 1.90 Earnings per shA 2.10 .40 25 20 .40 .50 .60 .60 .60 .60 .60 .15 .10 .40 Div'ds Decl'd per she .40 4.07 3.62 2.73 2.79 1.42 1.08 1.15 1.39 1.67 1.90 1.82 1.76 1.77 1.96 1.92 1.44 1.50 1.60 Cap' Spending per sh 1.95 7.02 01.83 2.55 d7.22 02.43 d. 18 4.03 4.04 6.69 6.31 7.23 7.34 8.78 9.03 8.37 7.71 9.40 10.55 Book Value per sh 12.60 1846.0 1892.5 2207.0 2396.3 3220.5 3782.7 3729.9 3946.0 3946.0 3938.0 3960.0 3974.3 3973.4 3978.6 3964.9 3978.7 4000.0 4050.0 Common Shs Outst'g CD 4150.0 8.3 NMF 6.7 6.8 7.7 9.5 13.7 8.1 7.2 6.2 NMF 28.2 Bold figures are Avg Ann'i P/E Ratio 11.0 .44 NMF .43 .43 .49 .53 .72 41 38 .31 .61 NMF 1.45 Value Line Relative P/E Ratio .60 3.8% 3.2% 1.8% 2.6% 3.1% 4.0% 4.8% 5.1% 5.8% 6.5% 2.1% estimates Avg Ann'l Div'd Yield 1.7% CAPITAL STRUCTURE as of 9/30/21 136264 134252 146917 144077 149558 151800 156776 160338 155900 127144 137550 156950 Revenues (Smill) 166500 Total Debt $144.5 bill. Due in 5 Yrs $127.0 bill. LT Debt $97.2 bill 14.6% 13.0% 11.0% 11.5% Market Share 13.0% LT Interest $5.1 bill. (Total int. coverage: 1.9x) 12.3% 11.5% 11.3% 9.9% 12.4% 12.7% 10.3% 7.2% 5.8% 3.2% 12.5% 12.0% Operating Margin 12.5% (73% of Capl) 7892.0 5665.0 6596.0 4633.0 7373.0 7054.0 7602,0 3677.0 47.0 d1279 6655 7670 Net Profit (Smill) 8720 9.7% 26.6% 23.1% 26.3% 28.1% 31.9% 6.4% 15.0% 15.0% 25.0% 14.0% 16.0% Income Tax Rate 21.0% Pension Assets 12/20 $82.2 bill. $ 5.8% 4.2% 4.5% 3.2% 4.9% 4.6% 4.8% 2.3% NMF 4.8% 4.9% Net Profit Margin 5.2% Oblig. $88.9 bill. 47211 61928 61851 76241 83979 18180 21302 19080 15915 19552 18850 20125 Working Cap'l (Smill) 24025 Common Stock 3,996.2 mill shs. 59374 85927 76868 79999 75657 93301 102666 100120101361 110341 98000 95500 Long-Term Debt (Smill) 88000 (Includes Common and Class B) 15028 15947 26383 24832 28642 29170 3489035932 33185 30690 37600 42635 Shr. Equity (Smill) 52300 as of 10/22/21 13.2% 7.4% 8.2% 6.1% 8.6% 7.3% 7.1% 3.2% .4% 6.5% 7.5% Return on Total Cap'l 8.0% 52.5% 35.5% 25.0% 18.7% 25.7% 24.2% 21.8% 10.2% .1% 17.5% 18.0% Return on Shr. Equity 16.5% 11.3 .. .. 32 48% 19% Other Earnings -33.5% CURRENT POSITION 2019 2020 9/30/21 13% 24% 42% 34% 79% NMF NMF (SMILL) 21% All Div'ds to Net Prof Cash Assets 17504 25243 27429 BUSINESS: Ford Motor Company is the second-largest domestic for about 35% of 2020 sales. Sold Volvo, 8/10. Has about 186,000 Receivables 62888 52394 43451 automobile manufacturer. Its vehicle brands include Ford and Lin- employees. Officers and directors own 0.3% of stock: State Street, Inventory (FIFO) 10786 10808 13508 2286928299 22580 coln. Sales represented 13.0% of U.S. car and truck market in 8.9%; Vanguard Group, 7.4%; BlackRock, 7.0% (4/21 Proxy). Current Assets 114047 116744 106968 2020. Also engages in vehicle leasing and rental, and the manufac- Chairman: William Clay Ford, Jr. CEO: & Director: James D. Farley, Accts Payable 20673 22204 22923 turing of electronic equipment. Financial Services Group includes Jr. Inc.: DE. Address: One American Road, Dearborn, MI 48126. Debt Due 53946 51163 47323 Ford Motor Credit and U.S. Leasing. Foreign operations accounted Telephone: 313-322-3000. Internet: www.ford.com. Other 23513 23825 18787 Current Liab. 98132 97192 89033 Ford remains on track for significant Lightening (a zero-emissions version of the bottom-line improvement this year. ANNUAL RATES Past top-selling pickup) and the Maverick (a of change (per sh) Past Estd 18:20 Third-quarter results came in better than five-passenger hybrid truck that boasts 42 10 Yrs. 5 to 24-26 Sales -1.5% 1.5% expected, although still down versus the miles per gallon and a base price starting "Cash Flow" -2.0% -7.5% 12.0% year before. Momentum is building thanks below $20,000). Management anticipates 47.5% Dividends to increases in semiconductor availability, -2.0% -2.0% that improved semiconductor availability Book Value 4.5% 7.0% and thus, wholesale volume shipments. will drive a 10% increase in wholesale Cal- QUARTERLY REVENUES (5 mill.) This is helping to offset inflationary cost units next year, versus roughly four mil- Full endar Mar 31 Jun 30 Sep.30 Dec.31 Year increases. Reflecting the improving pros- lion units in 2021. Altogether, we have pects, we have raised our 2021 earnings raised our 2022 earnings estimate by 2018 41959 38920 37666 41793 60338 estimate $0.70, to $1.65 a share, which $0.35, to $1.90, suggesting a 15% improve 2019 40342 38853 36990 39715 55900 would mark the company's best showing ment versus this year. 2020 34320 19371 37501 35952 27144 2021 36228 26752 35683 38887 137550 since 2017. The company plans to maintain in- 2022 38000 38950 3850041500 156950 Increased production_should drive vestment spending at an elevated profits higher in 2022. The global micro- level. Management is targeting a run rate Cal EARNINGS PER SHARE A Mar 31 Jun 30 Sep.30 Dec.31 Full chip shortage has been the biggest limiting of about $7 billion a year, making for total Year 2018 .43 25 factor for automotive sales. Moreover, it is capital expenditures of more than $40 bil- d.03 .92 2019 now widely projected to carry over into lion between 2020 and 2025. This includes .29 .04 d.42 .01 2020 d.50 d.70 2023. On the plus side, the combination of over $30 million for battery-electric vehicle 2021 .81 25 1.65 low dealer inventories and high demand is development. 2022 .50 .50 .45 1.90 translating into strong pricing. On top of These shares have broad investment this, Ford has been prioritizing more-appeal. In addition to it being a timely se- Cal- QUARTERLY DIVIDENDS PAID B endar Mar 31 Jun 30 Sep.30 Dec.31 Full popular, higher-margined models. Addi- lection for the year ahead, we also project Year 2017 .15 tionally, the company has an impressive worthwhile appreciation potential out to 15 15 .15 2018 .15 60 lineup of vehicles with long waiting lists, 2024-2026. Also, the recently reinstated .15 2019 .15 .15 .15 60 such as the new Bronco and all-electric dividend serves to make it a more compell- .15 2020 .15 .15 Mustang Mach-E. Plus, the launch sched- ing long-term selection. 2021 .10 ule includes the eagerly anticipated F-150 Mario Ferro November 12, 2021 endar 27 28 .14 .45 .11 .60 45 .15 15
Step by Step Solution
There are 3 Steps involved in it

Get step-by-step solutions from verified subject matter experts