

Question: Using the values you found for b 0 and b 1 and, calculate Y predicted values for each X value, andplot the regression line (X
Using the values you found for b0and b1and, calculate Y predicted values for each X value, andplot the regression line (X by Ypred)
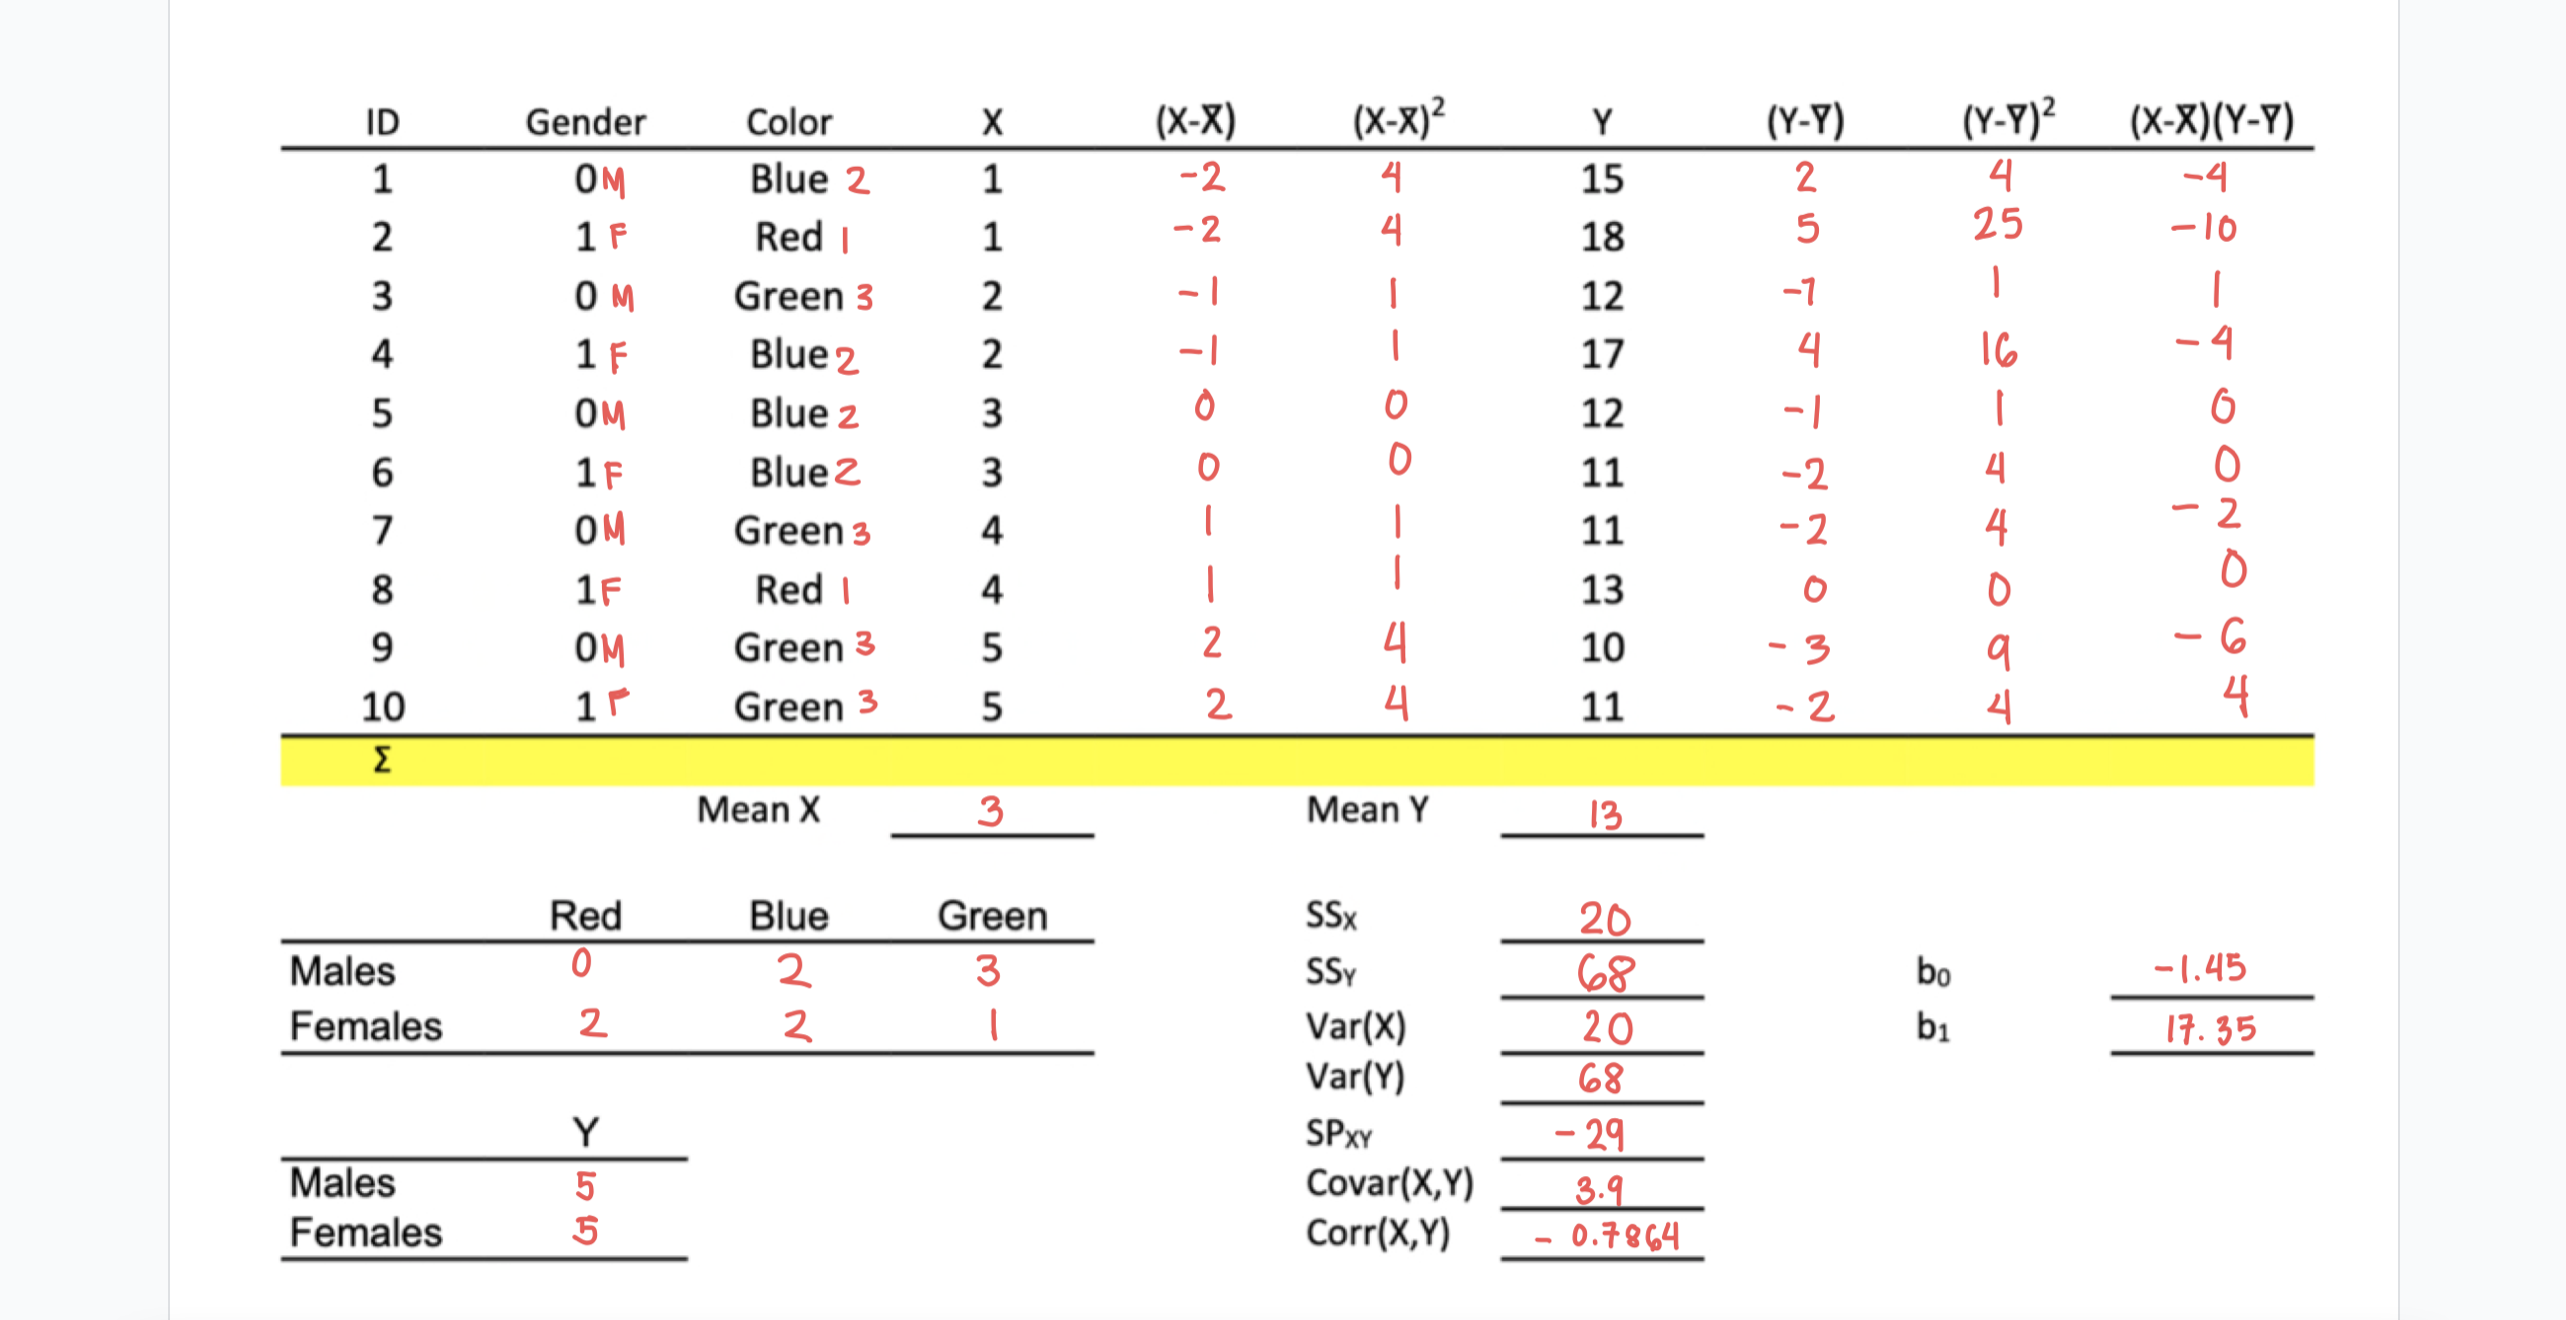
ID Gender Color X (X-X) (X-X) 2 Y ( Y-Y) ( Y-Y)2 ( X-X ) (Y-Y) OM Blue 2 15 4 - 4 1 F Red I 18 25 OM Green 3 12 1 F Blue 2 17 OM Blue 2 12 UIVIA A W W N N HA NN - - OOLINN ME -- OO - -A 1 F Blue 2 NWONNIELUI + RONDO A - O OM Green 3 1 1F Red I 13 OM Green 3 10 Green 3 11 Mean X 3 Mean Y 13 Red Blue Green SSx 20 Males 0 2 3 SSY 68 bo -1.45 Females 2 Var(X) 20 b1 17.35 Var(Y) 68 Y SPXY - 29 Males Covar(X,Y) 3.9 Females Corr(X,Y) - 0.7864
Step by Step Solution
There are 3 Steps involved in it
1 Expert Approved Answer
Step: 1 Unlock

Question Has Been Solved by an Expert!
Get step-by-step solutions from verified subject matter experts
Step: 2 Unlock
Step: 3 Unlock